March 11, 2024
Eric Van Nostrand, Assistant Secretary for Economic Policy (P.D.O.)
Laura Feiveson, Deputy Assistant Secretary for Microeconomics
Tara Sinclair, Deputy Assistant Secretary for Macroeconomics
State, local, and Tribal governments play a central role in our economy, but were put in an especially precarious position when the pandemic hit in 2020. Tax revenues declined at the same time as needs for government support rose. In response, the federal government organized historic transfers to state, local, and Tribal governments. This federal financial support enabled these governments to deliver necessary services in the recovery and continues to put them in a robust position going forward, strengthening our national economy.
This blog highlights the important role state, local, and Tribal governments play in the U.S. economy and compares the dramatic differences in their recoveries in the years following the COVID recession compared to the years after the Global Financial Crisis (GFC) of 2007 to 2009. We find that:
- State and local governments are important to the national economy, constituting almost 15 percent of GDP and employing over 20 million people.[1]
- State and local governments faced acute expenditure needs in the wake of the pandemic. State and local spending on unemployment insurance, other public assistance, and health and hospitals rose to $230 billion above trend in 2021.
- After the GFC, state and local budget cuts were a severe drag on the local economy for years. The American Rescue Plan’s focus on state and local governments avoided that pitfall. Employment in state and local governments recovered almost three times faster than after the GFC, and the state and local government sector were contributing positively to economic growth within just 10 quarters after the pandemic began.
- The recovery from the COVID recession was especially geographically inclusive. In 387 out of 389 Metropolitan Statistical Areas (MSAs), the unemployment rate today is lower than the median rate over the past 30 years. And those MSAs that typically face higher unemployment have seen bigger improvements.
- State, local, and Tribal governments are using support from the American Rescue Plan in innovative ways to grow their economies, create jobs, and make their communities stronger and more resilient. The investments that originally helped governments respond to and recover from the pandemic are also setting their economies up for long-run success by investing in the workforce and disadvantaged communities, as is consistent with President Biden’s economic agenda and Secretary Yellen’s focus on modern supply-side economics.
The Importance of State and Local Governments to the American Economy
In 2023, state and local government spent $4 trillion on the wide range of public goods and services that citizens use on a day-to-day basis. State and local spending falls into seven main categories: public assistance (which includes the state-funded part of unemployment insurance), elementary and secondary education, higher education, health and hospitals, highways and roads, criminal justice, and housing and community development.[2] These spending categories play a key role in protecting our most vulnerable citizens; keeping our citizens healthy; building and maintaining public infrastructure like roads, parks, libraries, and utilities; and investing in our future, most notably through public education. Local governments play a particularly important role in education, with 40 percent of direct local government spending going to elementary and secondary education in 2020.[3]
Figure 1: Total Expenditures of State and Local Governments, Fiscal Year 2021
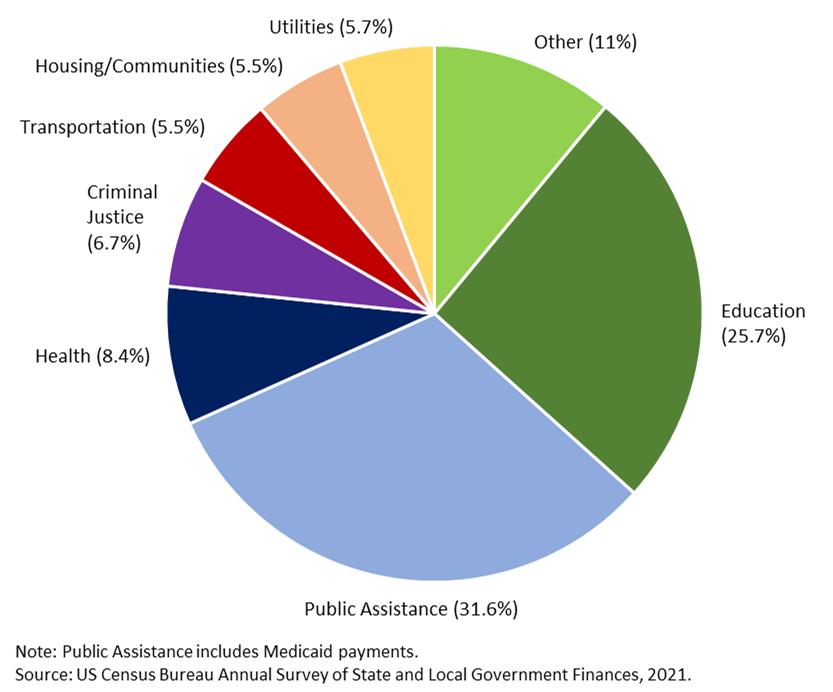
At nearly 15 percent of GDP, the state and local government sector plays an extremely important role in the economy. In January 2024, state and local governments were responsible for more than 20 million jobs, or 13 percent of total employment and almost seven times the Federal workforce. State and local government employment was the third largest sector in January 2024, behind professional and business services (23 million) and healthcare and social assistance (22 million). Within state and local employment, education employment looms large, accounting for 53 percent of employment in the sector.
The Pandemic: An Acute Time of Need for State and Local Governments
Like most sectors of the economy, the state, local, and Tribal government sector was in precarious health throughout 2020 and the beginning of 2021. High unemployment and pandemic-specific needs strained the budgets of these governments. As unemployment rose, more people became eligible for income-based transfers, such as unemployment insurance and other public welfare, automatically drawing more from state and local budgets. And pandemic-related expenditures by state and local governments on health and hospitals rose in 2020 and 2021 as state and local governments rushed to expand capacity at hospitals and to enforce new safety protocols for healthcare workers.
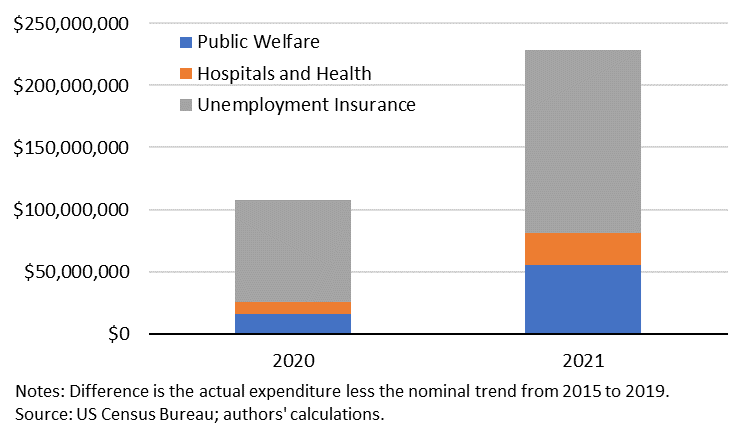
Figure 2 shows that these spending categories rose above the pre-pandemic trend by $110 billion and $230 billion in fiscal years 2020 and 2021, respectively.[4] We break out unemployment insurance (UI) separately from other welfare programs as state UI is typically funded through a trust fund and so does not represent the same draw on general revenues. Without UI, the two other categories together rose a cumulative total of $105 billion overall above trend over the two years.
Figure 2: Increase in Expenditure Relative to Trend
These calculations likely understate the increased expenditure needs of state and local governments related to the pandemic. For example, public schools and teachers had to adapt quickly to learn how to educate their students remotely or with social distancing. These adaptations required costly mitigation strategies such as hybrid technology and better air filtration systems.
At the same time that expenditures were strained, state and local own-source revenues (that is, general revenues that are not transfers from the Federal government) came in 3.5 percent below trend in the fiscal year 2020, before returning to about trend in fiscal year 2021.[5] Given the increased expenditure needs unmet by own-source revenues, balanced budget rules forced state and local governments to cut expenditures in other parts of their budgets.[6] Indeed, in the fall of 2020, 31 states reported using spending cuts to balance their budgets for fiscal year 2021. Further cuts would have cut key services to households at a critical time with the possibility of dragging down the national economy. In fact, we saw a stark example of this in the Global Financial Crisis.
Learning Lessons from the Global Financial Crisis
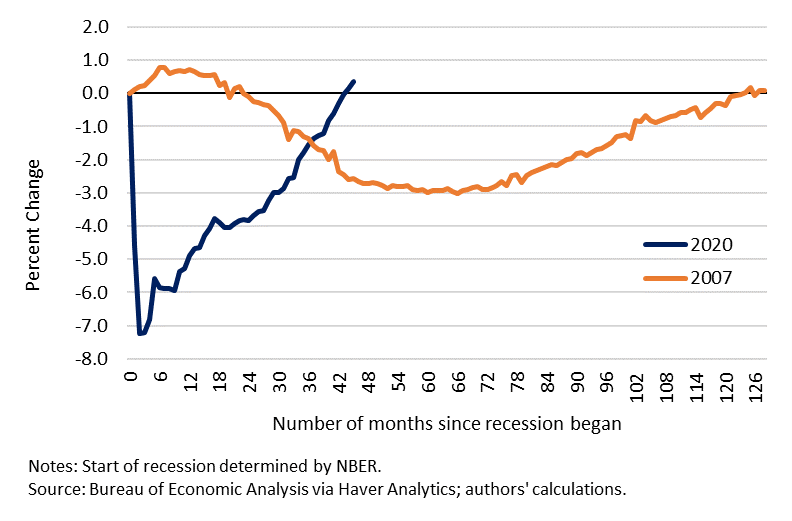
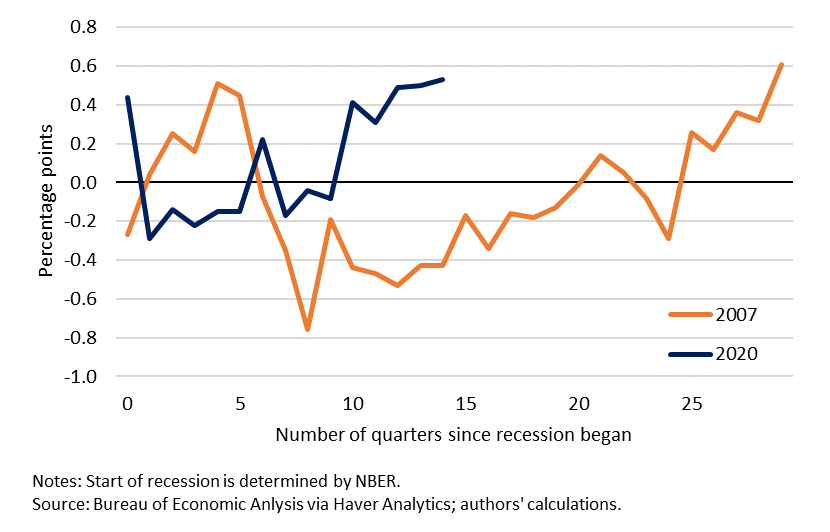
One important lesson from the GFC was that state and local budget cuts can impose severe costs on the national economy, with long-lasting reverberations. State and local government employment began falling two years after the onset of the GFC recession and did not fully recover for a decade (Figure 3). And declining state and local government spending was still a drag on GDP growth more than five years (21 quarters) after the onset of the recession (Figure 4). The American Recovery and Reinvestment Act of 2009 provided about $290 billion in aid to state and local governments, but that fell short of what was needed.[7]
The costs of insufficient state and local spending for both the macroeconomy and for American households became clear over the decade following the GFC.[8] The slower recovery meant deeper economic scars. Wages grew slowly in real terms, and new entrants into the job market faced deteriorated job prospects.[9] There were fewer opportunities for those who lost their jobs to find others, meaning workers endured longer unemployment spells and incurred greater earnings losses than typically happens in an expansion.[10]
Figure 3: State and Local Government Employment Change During and After Recent Recessions
Of course, there are many drivers of the differences between the recoveries from the GFC and COVID recessions, and we might expect an overall recovery from a pandemic-driven economic shutdown to be faster. But the focus on state and local governments in the post-COVID recession is also an important difference worth exploring.
During and following the COVID recession, the federal government transferred a total of $900 billion to state, local, and Tribal governments, enabling state and local spending to follow a very different path.[11] In particular, the American Rescue Plan provided direct fiscal relief to states, Tribal governments, territories, counties, cities, and towns through the State and Local Fiscal Recovery Funds (SLFRF) program, which alone totaled $350 billion.
Figures 3 and 4 depict the contrast between the two recessions in the pace of recovery in the state and local government sector. In the COVID recession, the turmoil and uncertainty faced by state and local governments due to the pandemic led to expenditure cuts, reflected in a contraction of public employment. However, by 2022, state and local expenditures had rebounded, supporting a robust economic recovery. Thus, rather than a slower recovery with years of drag as occurred with the GFC, employment in state and local governments recovered almost three times faster than after the GFC, and the state and local government sector contributed positively to economic growth within just 10 quarters.
Figure 4: State and Local Government Contribution to Quarterly GDP Growth During and After Recent Recessions
The Geographic Reach of the American Rescue Plan
The ARP, and particularly its SLFRF program, provided direct support to nearly all state, local, and Tribal governments, including territories, counties, cities and towns, and other special districts. The broad reach of these policies, in turn, supported a notable geographic breadth in the economic recovery.
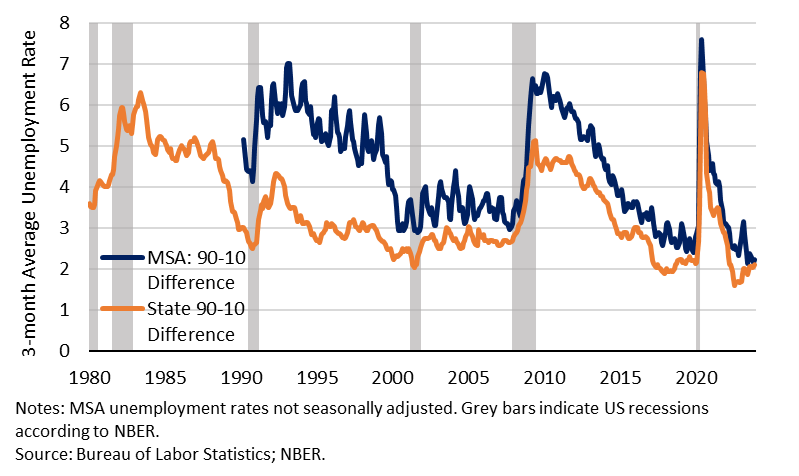
One demonstration of the geographically widespread recovery is that, at the MSA and state level, the dispersion of unemployment rates is now historically low, well below pre-pandemic levels (see Figure 5). This is a very different pattern than what we saw in the slow recovery after the GFC when the dispersion of local unemployment rates remained elevated.
Figure 5: Dispersion of State and MSA Unemployment Rates
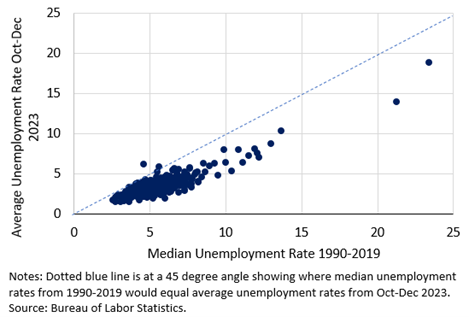
In addition, in 387 out of 389 MSAs, the unemployment rate now is lower than the MSA’s median rate over the past 30 years (as of December 2023). And MSAs with the highest median 30-year unemployment rates have seen the largest reductions in their current unemployment rates (Figure 6).[12]
Figure 6: MSA Unemployment Current vs. Long Run
Paving the Way for a Stronger Future
State, local, and Tribal governments are using support from the American Rescue Plan in innovative ways to grow their economies, create jobs, and make their communities stronger and more resilient. The investments that originally helped respond to and recover from the pandemic are also setting up their economies for long-run success.
In line with Secretary Yellen’s focus on modern supply-side economics, investments in the workforce and underserved communities funded by the ARP have the potential to both grow the economy and ensure that growth is widely shared. And providing funds to local economies has allowed them to make smart, evidence-based investments designed for their specific needs.
One application of modern supply-side economics is the use of SLFRF funds to expand job training. For example, Travis County, Texas, invested in a new workforce program that is providing transportation assistance, laptops and mobile hotspots, educational assistance stipends, and subsidized employment for workers in work-based learning or apprenticeship programs.[13] In another example, the Mescalero Apache Tribe is implementing a workforce development program that provides scholarships to citizens and current employees to obtain certificates and further education in welding, carpentry, plumbing, electrical, and more – all critical and in-demand jobs to carry out the Tribe’s COVID-19 recovery plan. Investments such as these help individuals to receive the training they need, and, in doing so, increase local productivity and contribute to national economic growth.
Another modern supply-side investment has been the provision of support to workers with family members who need care, making it easier for those workers to balance their care responsibilities with their jobs. SLFRF funds have supported more than 700 innovative care economy investments such as childcare and paid family and medical leave that will lower costs for families while supporting participation in the labor force.[14] By removing barriers to participating in the workforce, these programs expand the supply of workers engaged in the economy.
A third example of modern supply-side economics is the affordable housing programs in the ARP. Over $18 billion of SLFRF funds have been geared towards housing-related investments. This represents a substantial 33 percent expansion over the annual amount state and local governments typically spend on housing and community development. Ensuring the provision of safe, affordable housing strengthens the economy by allowing workers to locate closest to the jobs where they are most productive and by providing benefits to children that increase their future long-term success.[15]
Conclusion
State, local, and Tribal governments have an important role in the lives of Americans, and they faced severe challenges in the wake of the COVID pandemic. Fiscal support from the ARP shared widely across states, Tribal governments, territories, counties, cities, and towns ensured that these governments were able to afford the additional costs of addressing new pressures from the demands of COVID. These funds also helped to avoid the scarring of a slow recovery, reached areas that have been historically left behind, and increased the resilience of governments going forward.
[1] In Figure 1, “Public Assistance” includes all insurance trust expenditures, employment security administration, and veterans’ services. Education expenditures includes all of education services, including libraries. Housing/Communities includes solid waste management, natural resources, and parks and recreation. The “other” category includes governmental administration, interest on debt, liquor store expenditures, and other miscellaneous items. See State and Local Expenditures | Urban Institute.
[2] A substantial portion of this spending comes from state and federal funds. See State and Local Expenditures | Urban Institute.
[3] Because Tribal government are not included in the administrative datasets underlying many of the statistics in this blog, we generally refer only to “state and local” governments for the statistics in this piece.
[4] State and local government fiscal years typically run from July to June, such that Fiscal Year 2020 ended in June 2020.
[5] Some of the decline in FY2020 revenues had to do with a delay in tax revenue collection until FY2021.
[6] Summary_of_2020_Fall_Fiscal_Survey.pdf (higherlogicdownload.s3.amazonaws.com)
[7] Viewing ARPA Aid for States and Localities Through a Great Recession Lens | Tax Policy Center
[8] https://www.epi.org/publication/why-is-recovery-taking-so-long-and-who-is-to-blame/
[9] https://www.cbpp.org/research/chart-book-the-legacy-of-the-great-recession; The long-term labor market consequences of graduating from college in a bad economy - ScienceDirect
[11] Covid Money Tracker
[12] In Figure 6, the MSA represented by the dot that falls above the dotted line is Kahului-Wailuku-Lahaina, HI. The two MSAs that have median unemployment rates above 20 percent are El Centro, CA, and Yuma, AZ.
[14] Strengthening a Robust Economic Recovery with Child Care (newamerica.org)
[15] Hsieh, Chang-Tai, and Enrico Moretti. 2019. "Housing Constraints and Spatial Misallocation." American Economic Journal: Macroeconomics, 11 (2): 1-39. (Link); The Economic Implications of Housing Supply - American Economic Association (aeaweb.org); Chetty, Raj, Nathaniel Hendren, and Lawrence F. Katz. 2016. "The Effects of Exposure to Better Neighborhoods on Children: New Evidence from the Moving to Opportunity Experiment." American Economic Review, 106 (4): 855-902 (Link); Pollakowski, Henry O., Daniel H. Weinberg, Fredrik Andersson, John C. Haltiwanger, Giordano Palloni and Mark J. Kutzbach. 2022. "Childhood Housing and Adult Outcomes: A Between-Siblings Analysis of Housing Vouchers and Public Housing." American Economic Journal: Economic Policy, 14 (3): 235-72. Childhood Housing and Adult Outcomes: A Between-Siblings Analysis of Housing Vouchers and Public Housing - American Economic Association (aeaweb.org)