1. INTERPRETATION OF RESULTS:
The Federal Employee Viewpoint Survey (FEVS) offers unique insights into federal employees’ perceptions of employee satisfaction, engagement, and workforce management. Treasury values its employees and respects workplace perceptions. The results of the FEVS are analyzed for patterns and themes that help us identify Treasury’s strengths and challenges and are used to guide improvement efforts.
The 2023 core survey included 90 questions that measured federal employees’ perceptions about how effectively agencies manage their workforce. The 2023 survey also contained on additional question on telework, nineteen demographic questions, and eight Agency Specific Indicators. The survey results are reported across five indices and several sub-indices as listed below:
- Employee Engagement
- Leaders Lead
- Supervisors
- Intrinsic Work Experience
- Global Satisfaction
- Performance Confidence
- Diversity, Equity, Inclusion, and Accessibility (DEIA)
- Diversity
- Equity
- Inclusion
- Accessibility
- Employee Experience
The key message of Treasury’s 2023 FEVS continues to be stability.
There were no changes to any of the major indices, with one slight uptick in DEIA from 73% to 74%. The response rate continues to improve after the drop due to the pandemic, increasing by 2% to reach 44%. This still exceeds Government-wide rate of 39% and Very Large Agency rate of 35%.
Graph 1: Treasury FEVS Results on Key Indices (2018 – 2023)

Overall Analysis
The year-over-year lower response rate and global satisfaction rates reflect the on-going impact of the pandemic on the Federal workforce, including Treasury. However, despite these challenges, the 2023 FEVS does include a number of highlights:
- 64 out of 88 core survey items were identified as strengths (65% positive or higher).
- Since 2021, no survey items identified as challenges. (35% negative or higher).
- 39 survey items increased, and 17 survey questions decreased from 2022, none more than 3%.
- Global Satisfaction (65%) and Performance Confidence (87%) remain unchanged.
- Treasury’s Employee Engagement Index (74%) has remained unchanged for three years.
- 1% increase to several sub-indices, including Employee Engagement: Leaders Lead (65%), DEIA: Inclusion (79%), and DEIA: Accessibility (69%)
- No major indexes decreased. One of the sub-indexes decreased (Supervisors), though only 1-point from an already high 83% to 82%.
Treasury employees continue to remain committed to their mission, are willing to be held accountable for their work, and are proud of their contribution to the agency’s mission as evidenced by the five items with the highest positive scores shown below. These five items are the exact same highest scoring questions as 2022:
- 90% Positive- I am held accountable for the work I produce (Q11).
- 90% Positive- It is important to me that my work contribute to the common good. (Q89).
- 89% Positive – Employees in my work unit meet the needs of our customers (Q19). There was a 1% decrease from 2022.
- 89% Positive – My supervisor holds me accountable for achieving results. (Q51) There was a 1% decrease from 2022.
- 88% Positive – Employees in my work unit contribute positively to my agency’s performance. (Q20) There was a 1% decrease from 2022.
Diversity, Equity, Inclusion, and Accessibility Results
The DEIA Index aligns with Executive Order 14035: Diversity, Equity, Inclusion, and Accessibility in the Federal Workforce and includes four associated sub-indices measuring:
- Diversity: The practice of including the many communities, identities, races, ethnicities, backgrounds, abilities, cultures, and beliefs of the American people, including underserved communities. (Source: Executive Order (EO) 14035)
- Equity: The consistent and systematic fair, just, and impartial treatment of all individuals, including individuals who belong to underserved communities that have been denied such treatment. (Source: EO 14035)
- Inclusion: The recognition, appreciation, and use of the talents and skills of employees of all backgrounds. (Source: EO 14035)
- Accessibility: The design, construction, development, and maintenance of facilities, information and communication technology, programs, and services so that all people, including people with disabilities, can fully and independently use them. (Source: EO 14035)
On the DEIA index, Treasury achieved a result of 74%. This exceeds the overall Government- wide (71%) with additional detail on the sub-indices below:
- Diversity: 76%, exceeding Government-wide results (71%) by 5%.
- Equity: 72%, exceeding Government-wide results (67%) by 5%.
- Inclusion: 79%, exceeding Government-wide results (69%) by 10%.
- Accessibility: 69%, meeting Government-wide results (69%)
New Index: Employee Experience
New to the 2023 OPM FEVS is the Employee Experience Index, measuring engagement to the work and the organization. This index measures critical conditions conducive to employee engagement such as effective leadership, meaningful work, and the opportunity for employees to learn and grow on the job.
For this new index, Treasury achieved a result of 71%, above the 65% strength benchmark. However, this is slightly below the Very Large Agency score of 73% and the Government-wide score of 72%.
2. HOW THE SURVEY WAS CONDUCTED:
The 2023 FEVS for Treasury was administered for 8 weeks starting May 10th and closing on July 7th, via email by the Office of Personnel Management. Permanent, full time Treasury employees were surveyed. As in previous years, political appointees were ineligible to take the survey.
3. SURVEY ITEMS AND RESPONSE CHOICES
All survey items and response choices required by 5 CFR 250.302 were included in the 2023 Survey and are included in the 2023 Treasury Survey Results.
4. NUMBER OF EMPLOYEES SURVEYED, NUMBER RESPONDED, AND REPRESENTATIVENESS OF RESPONDENTS:
In 2023, 97,128 Department of the Treasury employees were surveyed and 42,362 took the FEVS. This was a response rate of 44%, an improvement of 2% from the 2022 FEVS.
Graph 2: Treasury FEVS Response Rate (2018 – 2023)
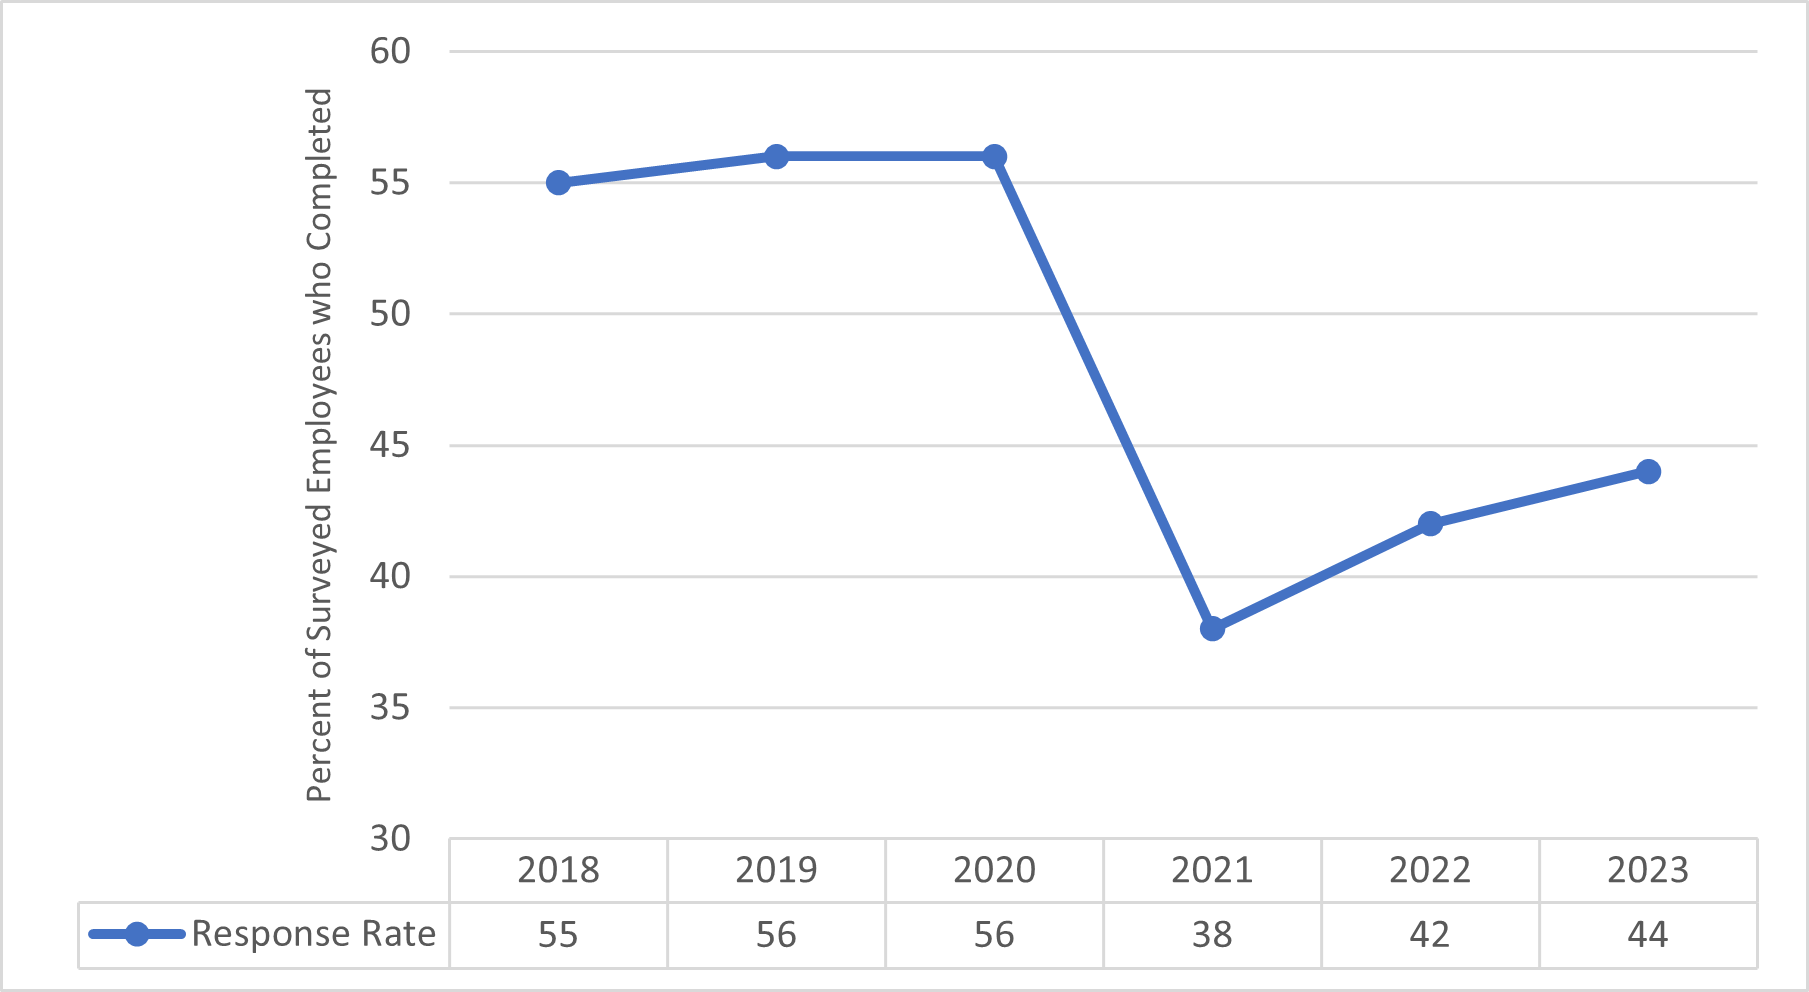
Table 2 - Representativeness of Respondents
| Category | Respondents |
|---|---|
| Male | 41% |
| Female | 59% |
| Senior Leader | 2% |
| Manager | 5% |
| Supervisor | 9% |
| Team Leader | 9% |
| Non-Supervisor | 74% |
| White | 66% |
| Black or African American | 22% |
| All other races | 13% |
| Hispanic, Latino or Spanish Origin - Yes | 13% |
| Hispanic, Latino or Spanish Origin - No | 87% |
| Individual with Disability - Yes | 16% |
| Individual with Disability - No | 84% |
| Transgender - Yes | <1% |
| Transgender - No | >99% |
| Straight, that is not gay or lesbian | 92% |
| Gay or Lesbian | 3% |
| Bisexual | 2% |
| Something else | 3% |
| 29 years and under | 5% |
| 30-39 years old | 17% |
| 40-49 years old | 25% |
| 50-59 years old | 33% |
| 60 years or older | 20% |