By Laura Feiveson, Deputy Assistant Secretary for Microeconomics
I. Introduction
Over the last few decades, there has been a pervasive sense of a decline in intergenerational mobility. A report in Science found that 90 percent of children born in the 1940s earned more than their parents did at age 30, while only half of children born in the mid-1980s have done the same.[1] As a result, young adults that judge their well-being by comparing their earnings to their parents may be dissatisfied. This note expands the intergenerational comparison beyond the documented decline in real earnings and looks at how a broad swath of measures of well-being of young adults today have evolved since their parents’ generation.
Some of the changes experienced over the last 30 years are positive, such as a rise in the real median earnings of young women and a recent surge in the net wealth of young households. Other changes have been neutral—neither good nor bad—as changes in culture and technology naturally lead to an evolution of choices and behavior. But many changes have contributed to an increasing sense of economic fragility among young adults. Young male labor force participation has dropped significantly over the past thirty years, and young male earnings have stagnated, particularly for workers with less education. The relative prices of housing and childcare have risen. Average student debt per person has risen sharply, weighing down household balance sheets and contributing to a delay in household formation. The health of young adults has deteriorated, as seen in increases in social isolation, obesity, and death rates. The outlook for the future is also more uncertain, with young Americans facing the mounting costs of climate change and deficit spending, both of which have built over the past few decades.
Many of these changes are a natural consequence of long-standing global trends. An aging population means that young adults today are competing for houses and jobs with more older workers than the young of their parents’ generation did. Increased globalization and technological advances brought an abundance of affordable goods to American consumers, but with the cost of fewer job opportunities for men without college degrees. The internet has changed the way people interact with one another, leading to fewer in-person interactions. A lack of adequate regulation has allowed global carbon emissions to rise steeply, and decades of deficit spending combined with a recent rise in long-term interest rates has put our fiscal trajectory on an increasingly unsustainable path.
We should expect that our society and culture will continue to evolve, and that the lives of young adults will necessarily look different from their parents’. However, Federal policy could and should also adapt to the changing world in ways that ease the difficulties faced by young Americans today and in the future. Expanding housing supply would bring down rents and home prices; providing quality and affordable childcare would relieve the financial burden of starting a family; expanding healthcare insurance would make critical healthcare more accessible; and investing in trade schools and registered apprenticeships would increase pathways to well-paying jobs.
The Biden-Harris Administration has made key investments in these areas, particularly with a historic expansion of infrastructure and clean-energy manufacturing that will generate high-quality workforce opportunities for years to come. But more government action—at the Federal, state, and local levels—is needed to tackle the high costs of housing, healthcare, and childcare today and to prepare for the climate and demographic changes coming.
II. Intergenerational Comparisons
In this section, we review a host of economic and social indicators that can help paint the picture of how young adults today may compare their experiences to their parents’ experiences. We focus, when possible, on young adults in the 25–39-year-old age range and show time series going back to 1990 to best capture the experience of their parents’ generation.
Labor Market
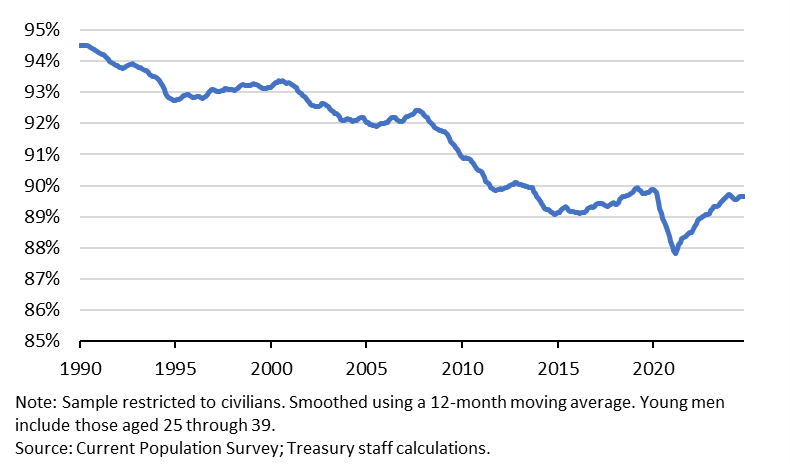
One of the most striking changes in the labor market over the past few decades has been the decline in labor force participation among young men, falling from almost 95 percent in 1990 to less than 90 percent in the most recent data (Figure 1). The decline in the labor force participation was unique to men: young women’s labor force participation fluctuated around 75 percent from 1990 through 2021, after which it rose to 78 percent during the pandemic recovery.
Figure 1: Labor Force Participation of Young Men
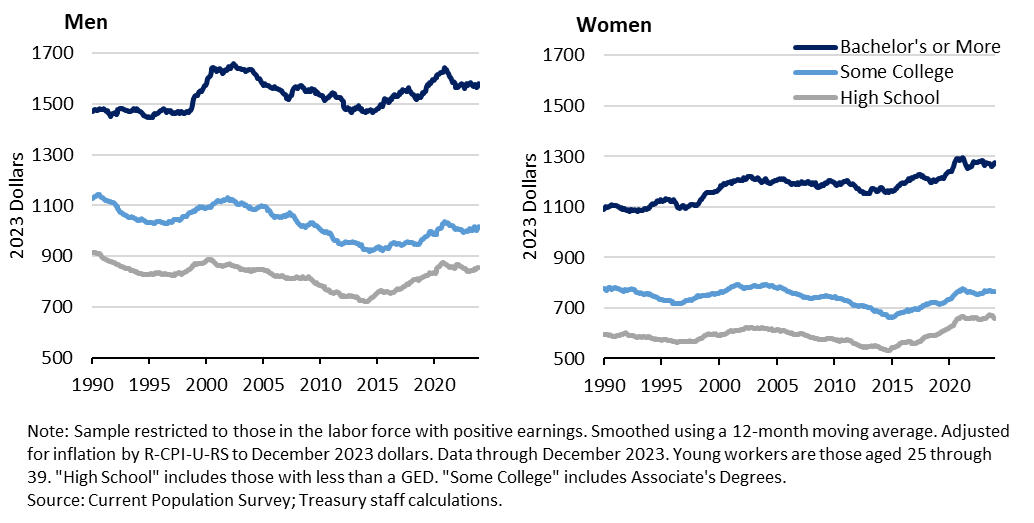
One explanation for the decline in young male labor force participation is the stagnation of their wages, particularly for lower educated men.[2] The left panel of Figure 2 shows that median weekly earnings—adjusted for inflation—declined by 9.9 percent and 4.1 percent from 1990 to 2023 for young men with at most some college and high school, respectively, and that men with bachelor’s degrees saw only a muted rise. The two less educated groups accounted for the majority (61 percent) of young male workers in 2024. Research focused on young men suggests that the decline in male participation and earnings are just two symptoms of a broader finding that young men without bachelor’s degrees are being left behind in today’s economy and society.[3]
In contrast, as shown in the right panel of Figure 2, the earnings of women with bachelor’s degrees (47 percent of young women workers in 2024) grew strongly, by 15.1 percent, from 1990 to 2023. This sharp increase reflects a continuing shrinkage of the male-female wage gap as women have gained more access to higher paid jobs and received more equitable pay. The wages of less educated women were more stagnant over this time period, although without the notable declines experienced by their male counterparts.
Figure 2: Median Usual Weekly Real Earnings of Young Workers by Education
The Cost of Living
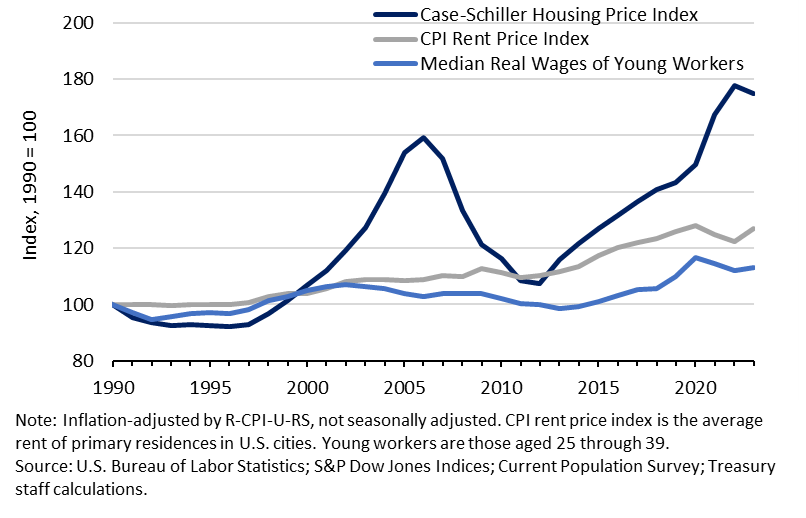
Homeownership—a goal for many young middle-class Americans—has become much more costly since 1990. Median home prices, adjusted for inflation, have almost doubled, whereas median real weekly earnings for young workers have increased only modestly (and fallen for young men, as shown previously). Rents, adjusted for inflation, have increased by less than home prices, but have still outpaced earnings. The rising cost of housing has affected almost all Americans. More than 90 percent of Americans live in counties where median rents and house prices grew faster than median household incomes from 2000 to 2020.[4]
Figure 3: Real Housing Price, Rent, and Income Indexes
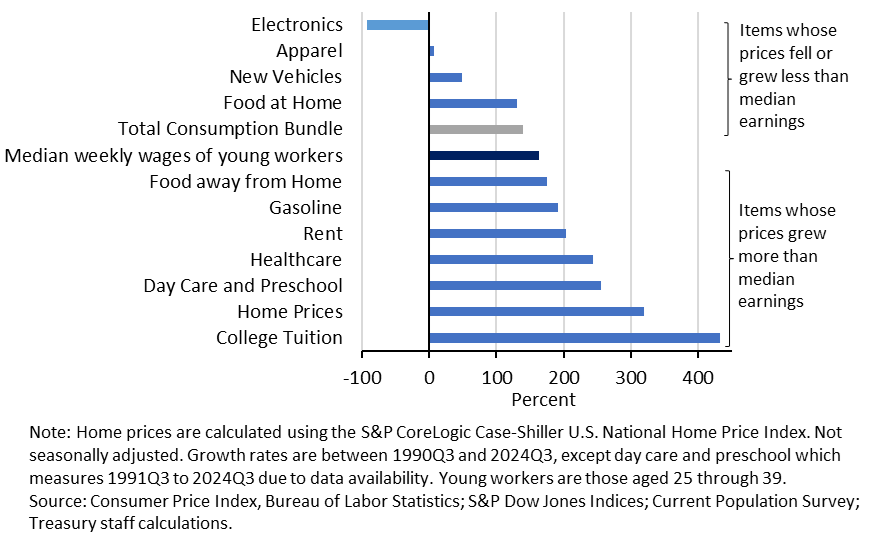
Not all prices of necessities have risen more than wages did since 1990. The prices of electronics, clothing, and cars have all either fallen or risen by less than the median weekly earnings of young workers. However, housing, childcare, healthcare, and education all stand out with their large increases in prices. These are costs that would weigh heavily on families with kids and may factor into decisions about whether or not to start a family.
Figure 4. Changes in Price for Select Goods and Services from 1990 to 2024
Balance sheets
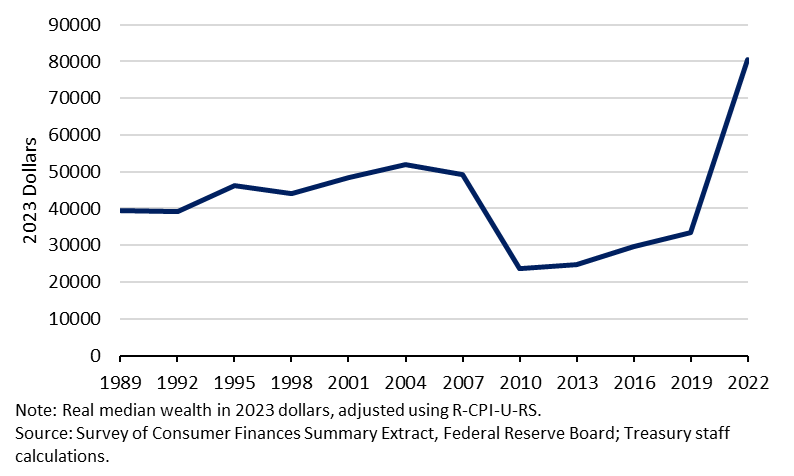
In 2019, the real median wealth of families with heads aged 25-39 was roughly the same level as it had been in 1989 (Figure 5). Household balance sheets of young Americans had stagnated for years and never fully recovered from the 2008 recession. This changed markedly in the recovery from the pandemic, when real median wealth for young Americans surged by over 140 percent in 2022, reaching higher levels than ever seen before. The sharp increase in wealth between 2019 and 2022 was broadly based across education, income, and racial groups.
Figure 5: Real Median Wealth: Age 25-39
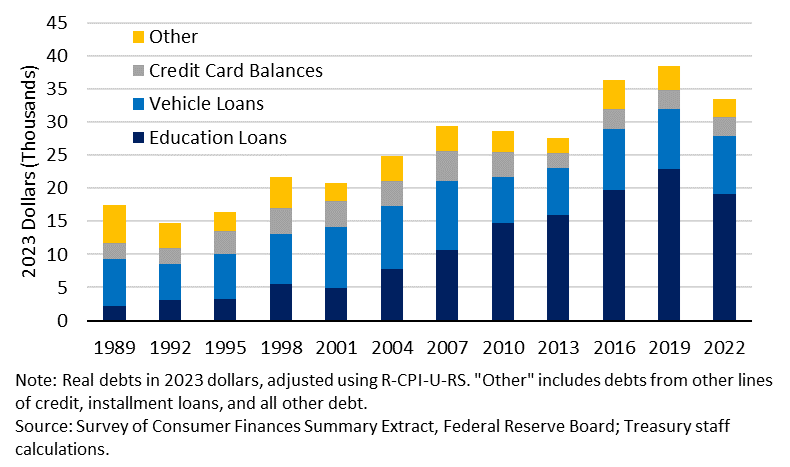
However, the recent increase in net wealth obscures some balance sheet challenges that have persisted even through the pandemic period. In particular, real non-housing debt per young adult has almost doubled from 1989 to the latest reading in 2022 (Figure 6). This rise was driven by student loan debt, which grew nine-fold since 1989, due to increased college attendance rates and skyrocketing tuitions.[5] Student loan debt now accounts for more than half of non-housing debt for this age group. Furthermore, holdings of student loan debt are now much more widely distributed than they were before. In 2022, 40 percent of young adults held student debt, in contrast to only 15 percent in 1989.
To be sure, a large portion of this student loan debt is associated with high-returns education and will thus be reflected in higher wages that accumulate over time. However, not all debt holders have experienced those high returns. About 42 percent of student loan debt holders between 25 and 39 years old do not have a bachelor’s degree. And student loans can still weigh upon the household decisions of even those that do expect to have high earnings later in their careers. Empirical evidence finds that student loan debt has been shown to delay household formation, lower homeownership rates, decrease enrollment in graduate programs, and discourage public service jobs.[6]
Figure 6: Average Real Non-Housing Debts: Age 25-39
Household structure
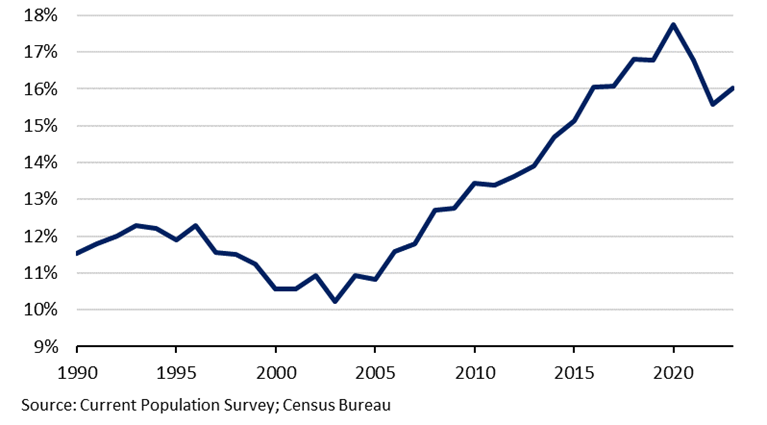
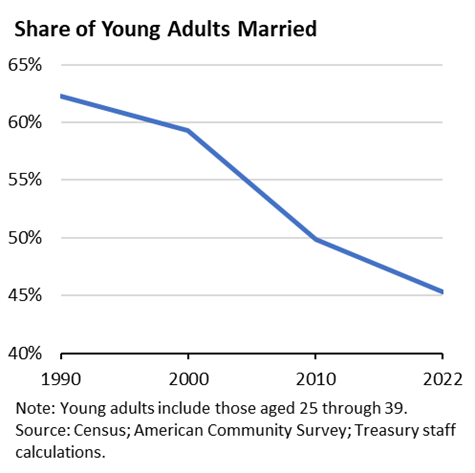
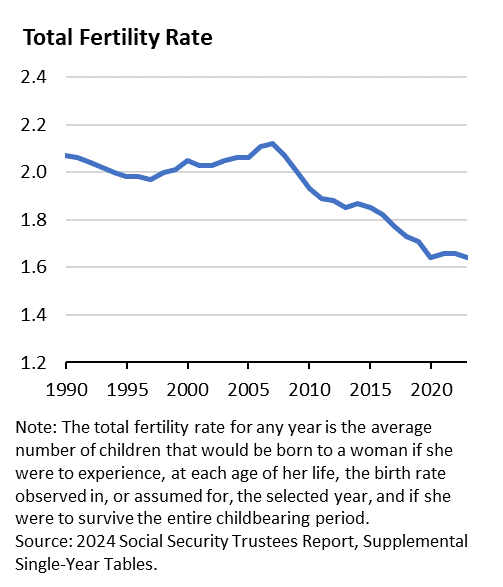
Young Americans today are more likely to live with their parents (Figure 7) and are less likely to be married or to have children (Figure 8). To the extent that these changes to household structure reflect cultural shifts since their parents’ generation, they are in themselves neither bad nor good. However, there is evidence that the shift is at least partially due to the economic factors described above: the stagnation of real wages, the rise in housing and childcare costs, and the rise in student debt.[7]
Figure 7: Share of Adults Aged 25-34 Living with a Parent
Regarding the choice of when to start a family, yet another factor that may be weighing on young adults’ decisions is the stress of balancing paid work and family life. Parents of young children collectively spent 2 to 6 hours more per week on paid work, housework, and childcare in the 2015 to 2019 period than just 10 years prior.[8] In 2023, half of parents reported that “most days their stress is completely overwhelming” as compared to a quarter of non-parents.[9] Leisure time for families has shrunk: Workers are half as likely in 2022 to be on vacation than they were in 1980 in any given week.[10] The evidence has mounted sufficiently such that in August 2024, Surgeon General Vivek Murthy issued an advisory about the harmful effects of parental stress.[11]
Figure 8: Marriage and Fertility
Physical and Mental Health
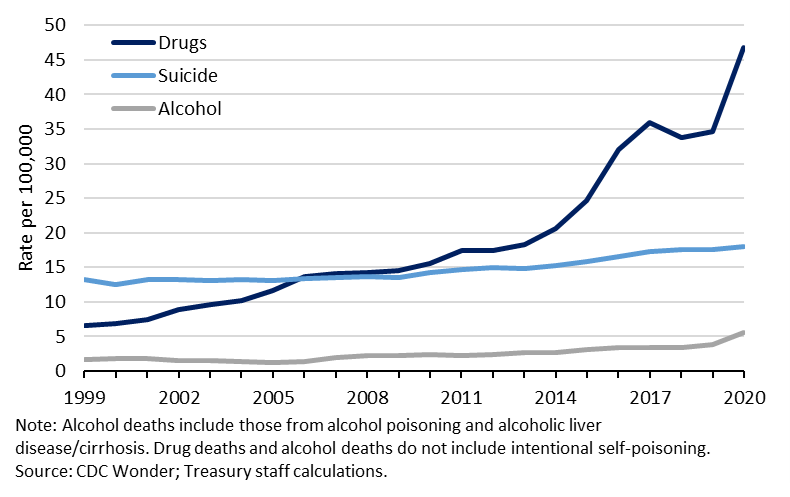
The health of young Americans has declined in many ways since their parents’ generation. The prevalence of obesity—which increases the risk of heart disease, cancer, and other diseases—more than doubled amongst young Americans between 1990 and 2018, from 18 percent to 40 percent.[12] Death rates for young Americans have also risen in recent years after falling steadily for most of the 20th century. The 2019 (pre-pandemic) death rate among individuals aged 25-39 had increased by 17 percent since bottoming out in 1999.[13] This increase in mortality among young people is mostly accounted for by men, and reflects a rise in externally caused deaths, which includes suicides, accidents, and overdoses. While the uptick in suicides is notable, the single largest contributor to the jump in young people’s mortality is unintentional drug overdoses as shown in Figure 9, reflecting the devastating impact of the opioid epidemic on this generation of young adults.[14]
Figure 9: Deaths from Selected External Causes: Age 25-39
National data collected by the Centers for Disease Control (CDC) also show a worsening of mental health indicators over time since 1990, and this decline is concentrated among young adults.[15] The share of adults ages 18-25 who reported that they experience poor mental health on most days doubled between 1993 and 2020, and increased by 66 percent among those ages 26-49.[16]
While mental health is a complex issue, one hypothesis is that worsening rates of depression, anxiety, and suicidal ideation are exacerbated by increased use of social media and weaker links to friends, family, and community groups.[17] According to the American Time Use Survey, time spent in social engagement for young adults ages 25-34 years old decreased by roughly one hour per day on average from 2003 to 2019.[18] A 2019 nationally representative survey of more than 10,000 individuals found that 48 percent of Americans “always or sometimes felt isolated from others,” with the highest levels of loneliness seen among the youngest respondents.[19] In contrast, an older survey found that, in 1990, only 18 to 20 percent of adults indicated that they felt “lonely or remote from other people” in the past few weeks.[20]
Uncertainty about the Future
Finally, the adverse effects of both climate change and unsustainable fiscal policy loom larger than they did thirty years ago.
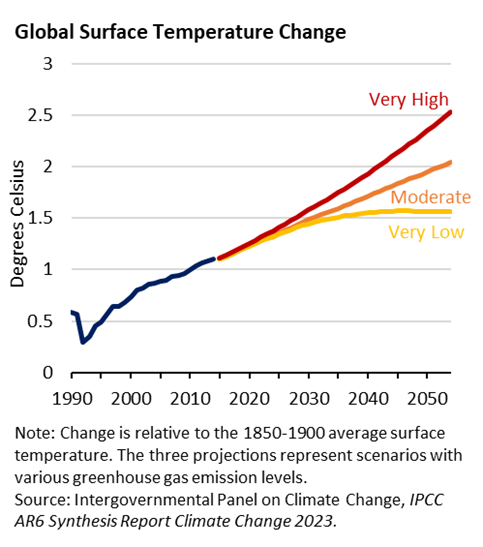
The left panel of Figure 10 shows that the global surface temperature is expected to continue to rise. Scientists agree that higher temperatures are likely to cause worsening weather events at higher frequencies, deeply impacting local communities.[21] Furthermore, higher temperatures may spur mass migration events as floods, droughts, wildfires, extreme heat, and climate-driven conflict drive people from their current homes.[22] Accordingly, young adults do appear to be concerned about the impact of climate change on their and their children’s futures.[23]
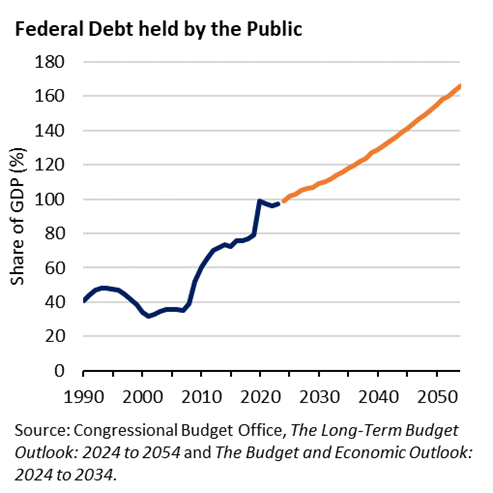
The right panel of Figure 10 shows that, under current policy, the Federal debt held by the public is expected to rise unsustainably.[24] Moving off this path would require higher taxes or significant spending cuts to Social Security and Medicare. Prospective cuts to retirement benefits may be particularly burdensome for younger Americans today, since their retirement savings will already have to be stretched further relative to earlier generations due to declines in participation in defined benefit pensions and increases in life expectancy.[25]
However, younger people are less concerned than older Americans about fiscal sustainability.[26] As such, high Federal debt and deficits do not yet appear to be a drag on the perceptions of young adults relative to their parents, although this may change if the negative consequences of unsustainable fiscal policy become widely understood and discussed. Currently, the Trustees of Social Security and Medicare predict that their trust funds will be depleted in 2033 and 2036, respectively, which will necessarily bring fiscal sustainability to the forefront of public debate within the next decade.[27]
Figure 10: Projections for the Future
III. Conclusion
The changes experienced by young Americans as described in this note are all interconnected to longstanding secular trends in the economy. For example, stagnating young male wages have been driven in large part by globalization and technological changes that decreased the demand for lower-educated workers in traditionally male-dominated jobs.[28] The rise in young female wages is connected to increasing female education rates and a continued shrinking of the male-female wage gap for similar occupations. Mental health deterioration and social isolation among young Americans has plausibly been worsened by the rise of social media, and the opioid epidemic was a primary factor in increased mortality rates among working age adults.[29],[30]
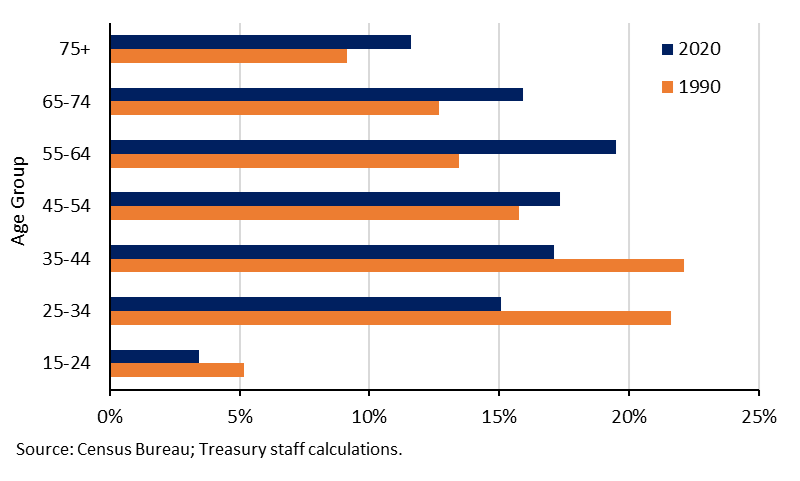
The causes cannot be fully covered in this note, but one that deserves special mention, due to its unique effect on young adults, is the aging of the U.S. population. Figure 11 shows the distribution of households as a share of total households with heads over the age 15 in 1990 and 2020. In 1990, the baby boomers were young adults, and households with heads aged 25-44 made up 44 percent of all households. By 2020, this group had shrunk to 32 percent as the baby boomers aged into older age brackets.
This shift has had profound effects on young adults today, who are competing for housing and jobs with older, wealthier, and more experienced counterparts. The aging of the population puts particular pressure on housing demand, as older Americans tend to demand more housing than younger adults. Indeed, even though housing construction has exceeded population growth since 2000, it has fallen woefully short of the country’s housing needs.[31] The aging of the population may have also contributed to a widening wage gap between older and younger workers by limiting higher-paying career opportunities for younger workers.[32] Finally, this demographic shift is contributing to serious challenges to fiscal sustainability as the number of social security recipients per every 100 payroll-paying workers is expected to increase from 30 in 1990 to 37 in 2024 and 44 in 2040.[33]
Figure 11: Household Share by Age Group and Year
The goal of government policy should not be to return to the economy of 1990. Not only would this goal be a fruitless endeavor given the demographic shifts and the unidirectional advances in technology and globalization, but it would erase the gains to many Americans that came from expanded education, less discriminatory workplaces, cheaper goods, and more household wealth. Instead, Federal, state, and local government policy should adapt by creatively tailoring their actions to tackle the unique difficulties faced by young adults today. Substantial investments in housing, childcare, healthcare, and workforce opportunities could lead to improvements that would be felt quickly by today’s young Americans. And tackling climate change and moving toward a more sustainable fiscal trajectory now could go far in significantly improving current young Americans’ futures.
[1] Chetty, Raj, et al. 2017. “The Fading American Dream: Trends in Absolute Income Mobility Since 1940.” Science 356 (6336): 398-406.
[2] Binder, Ariel J., and John Bound. "The declining labor market prospects of less-educated men." Journal of Economic Perspectives 33, no. 2 (2019): 163-190; Autor, David H., David Dorn, and Gordon H. Hanson. "The China syndrome: Local labor market effects of import competition in the United States." American economic review 103, no. 6 (2013): 2121-2168.
[3] Reeves, Richard, Of Boys and Men, Brookings Institution Press, 2022.
[4] Feiveson, Laura, Arik Levinson, and Sydney Schreiner Wertz, Rent, House Prices, and Demographics | U.S. Department of the Treasury, 2024.
[6] Mezza et al (2020); Robb and Schreiber (2019); Dettling and Hsu (2018); Bleemer et al (2014); and Rothstein and Rouse (2011).
[7] Paciorek, Andrew, The Long and the Short of Household Formation, FEDS series, April 2013; Acolin, Arthur, Desen Lin and Susan Wachter, Why do young adults coreside with their parents?, Real Estate Economics, November 2023; Cooper, Daniel and Maria Jose Luengo-Prado, Household formation over time: Evidence from two cohorts of young adults, Journal of Housing Economics, September 2018.
[8] American Time Use Survey. This figure includes hours spent on Housework, Food preparation and cleanup, Grocery shopping, Caring for and helping household members, and Working and work-related activities for married mothers and fathers with children under the age of 6.
[9] Stress of parents compared to other adults, American Psychological Association, Stress in America 2023, 2024.
[10] Van Dam, Andrew. 2023. “The mystery of the disappearing vacation day.” The Washington Post, February 10, 2023.
[11] Parents Under Pressure, U.S. Whitehouse, 2024.
[12] Fryar CD, Carroll MD, Afful J. Prevalence of overweight, obesity, and severe obesity among adults aged 20 and over: United States, 1960–1962 through 2017–2018. NCHS Health E-Stats. 2020; National Health and Nutrition Examination Survey, 1988-1994 and 2017-2018.
[13] Centers for Disease Control and Prevention, National Center for Health Statistics. 2021. National Vital Statistics System, Mortality 1999-2020 on CDC WONDER Online Database.
[14] Deaths attributable to suicide, alcohol, and unintentional drug overdose are sometimes referred to “deaths of despair.” Case, A., & Deaton, A. Rising morbidity and mortality in midlife among white non-Hispanic Americans in the 21st century.
[15] Centers for Disease Control and Prevention (CDC), Behavioral Risk Factor Surveillance System Survey Data, Atlanta, Georgia: U.S. Department of Health and Human Services, Centers for Disease Control and Prevention, 1993-2020.
[16] Udupa, N. S., Twenge, J. M., McAllister, C., & Joiner, T. E. Increases in poor mental health, mental distress, and depression symptoms among US adults, 1993–2020. Journal of Mood and Anxiety Disorders, 2, 100013, 2023.
[17] Twenge, J. M., A. B. Cooper, T. E. Joiner, M. E. Duffy, and S. G. Binau. Age, period, and cohort trends in mood disorder indicators and suicide-related outcomes in a nationally representative dataset, 2005–2017. Journal of Abnormal Psychology 128(3), 185, 2019.
[18] Kannan, V. D., & Veazie, P. J. US trends in social isolation, social engagement, and companionship⎯ nationally and by age, sex, race/ethnicity, family income, and work hours, 2003–2020. SSM-population health, 21, 101331, 2023.
[19] Loneliness and the Workplace: 2020 U.S. Report, Cigna, 2020.
[23] In a 2020 Morning Consult poll, 34 percent of childless millennials (those born between 1981 and 1996) cited concerns about climate change as a reason that they did not currently have children. In contrast, only 16 percent of childless baby boomers (those born between 1946 and 1964) cited climate change as a reason. From Morning Consult. 2020. National tracking poll #200926 Crosstabulation Results.
[24] This Congressional Budget Office (CBO) projection assumes that future Social Security and Medicare benefits will be paid out in full even after Trust Fund reserve depletion, implicitly assuming a change in the current law regarding the funding structure of those programs.
[25] National Vital Statistics Reports Volume 70, Number 19 March 22, 2022; https://www.cdc.gov/nchs/data/hus/2010/022.pdf; Private Pension Plan Historical Bulletin - Cover
[26]Among 18-29 year olds, 43 percent thought reducing the budget deficit should be a priority. This percentage was 56 percent among 30-49 year olds and 67 percent among those 65 and older. See the Pew Research Center survey.
[27] Specifically, the Old-Age and Survivors Insurance (OASI) Trust Fund is expected to be depleted in 2033 and the Hospital Insurance (HI) Trust Fund is expected to be depleted in 2036. After depletion, ongoing OASI and HI payments will be reduced without new legislation. See The 2024 OASDI Trustees Report.
[28] Autor, D. H., & Dorn, D. (2013). The growth of low-skill service jobs and the polarization of the US labor market. American economic review, 103(5), 1553-1597.
[29] Braghieri, Luca, Ro'ee Levy, and Alexey Makarin. 2022. "Social Media and Mental Health." American Economic Review, 112 (11): 3660–93.
[30] Harris, K. M., Majmundar, M. K., & Becker, T. (Eds.). (2021). High and rising mortality rates among working-age adults. Washington, DC: National Academies Press.
