
By: Assistant Secretary for Economic Policy Benjamin Harris and Deputy Assistant Secretary for Macroeconomics Neil Mehrotra
Overview
The economic recovery from the pandemic in the United States has been historic relative to prior episodes and has also been robust relative to the recoveries of many other major advanced economies. And while a counterfactual recovery is impossible to observe, research suggests that the actions taken by the Biden Administration meaningfully contributed to the pace of recovery and strength of the labor market. Other advanced economies similarly undertook significant policy actions to respond to the pandemic that have bolstered their economic recoveries.
This blog compares the US recovery along five key characteristics relative to other advanced economies:
- The Size of the U.S Economy Has Exceeded its Pre-Pandemic Level
- Despite Higher Growth, U.S. Inflation is now comparable to most major Advanced Economies
- In Part Due to Differences in Labor Market Institutions, the U.S. Employment Recovery has Been Exceptionally Strong
- Rapid Economic Growth has led to Especially Rapid Improvement in the U.S. Fiscal Position
- The U.S. is Better Positioned than Others to Endure Commodity Shocks
This is not to suggest that the current recovery is without its challenges or is complete. Near-term inflation remains a concern, with core inflation still higher in the US, and long-term structural challenges remain. Still, many aspects of the U.S. recovery indicate a stronger recovery in the U.S.
U.S. Economic Recovery Fastest Among the G7
On average, real GDP across the G7 countries is now back to where it was prior to the start of the pandemic in the fourth quarter of 2019. However, there is considerable variability across countries. Not all G7 economies have recovered to their pre-pandemic size; by contrast U.S. real GDP is now 2.8 percent above the level at the end of 2019.
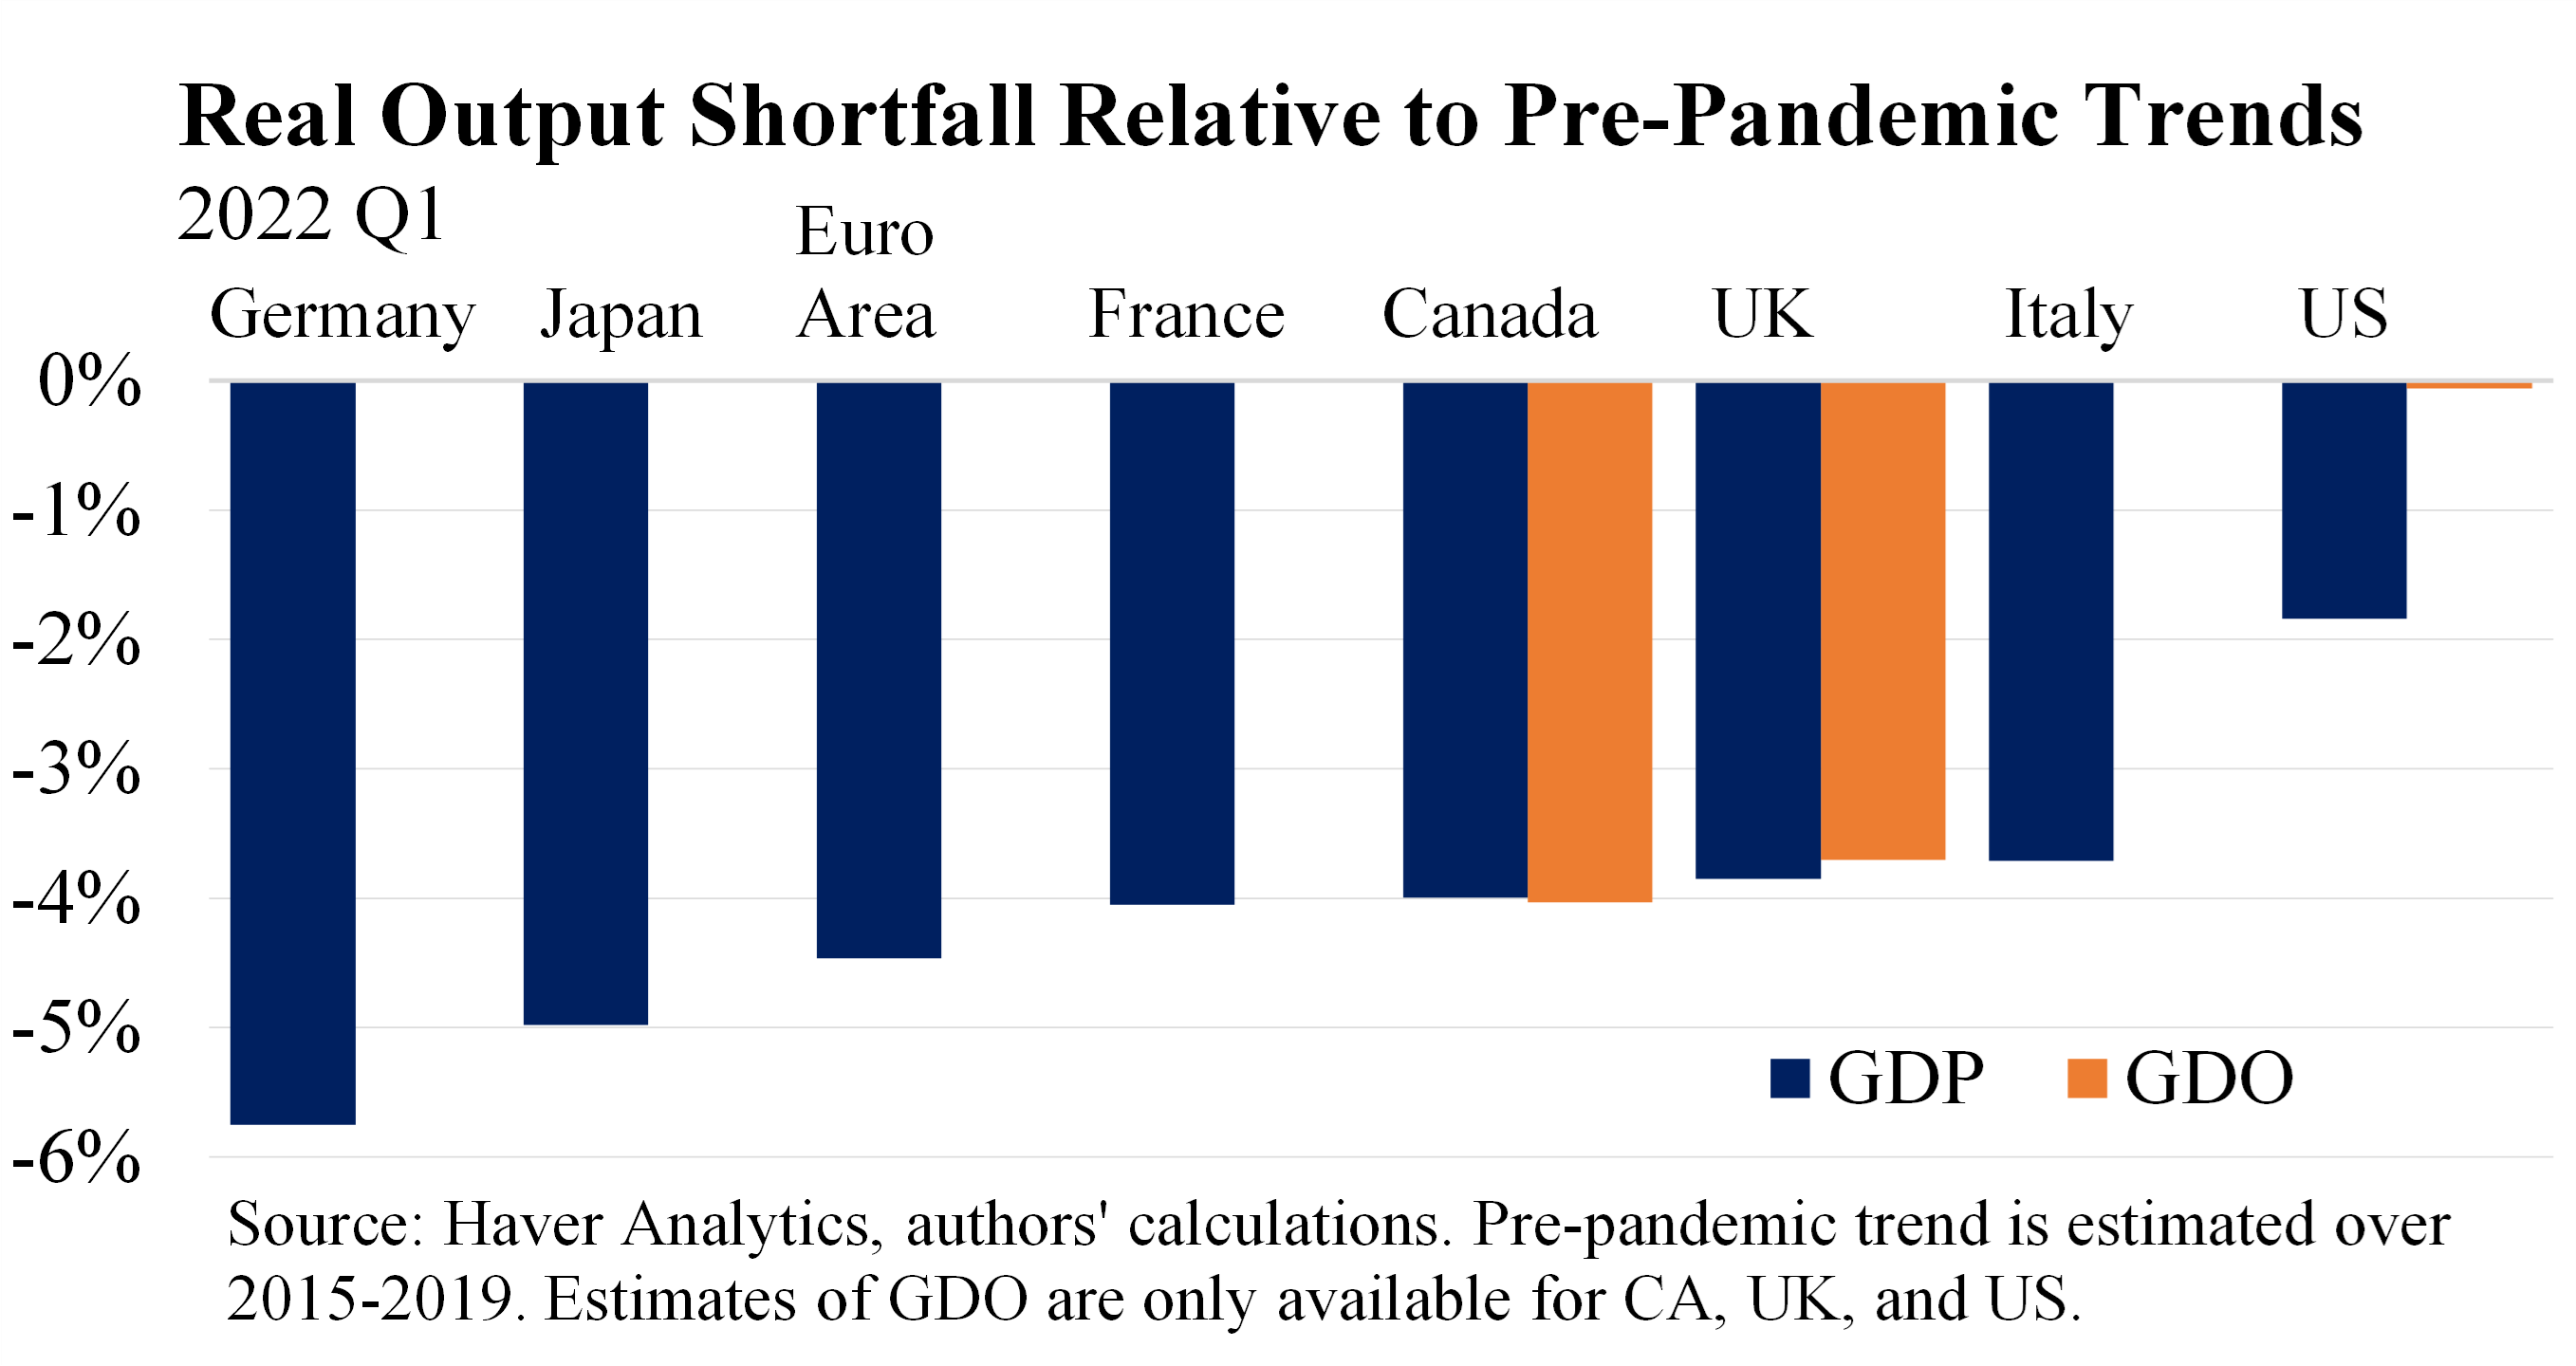
Relative to pre-pandemic trends, growth in all of the G7 countries continues to fall short. On average, real output in the G7 countries remains 3.9 percent below trend. The U.S. has performed better than other G7 economies (and the Euro area) with real GDP just 1.8 percent below trend. Importantly, too, the U.S. is using a larger share of its available resources: the U.S. output gap (the difference between what the economy is producing and what it can potentially produce) is less than the half the size of the next best performing economy in the G7. Keeping labor employed and capital utilized will help avoid scarring and position the U.S. economy well for the future.
Comparisons of GDP may actually understate the pace of the recovery in the United States. In the chart above, the orange bars show an alternative measure of output suggesting that the United States has performed even better. Using real Gross Domestic Output (GDO), which is an average of Gross Domestic Income (GDI) and GDP, the U.S. has effectively recovered to (0.1 percent below) its pre-pandemic trend.1 Unlike the U.S., the UK and Canada, for which estimates of GDO are also available, do not indicate substantial differences across alternative measures of output.
The faster recovery in the US reflects a more complete recovery in domestic consumption. U.S. household consumption expenditures returned to their pre-pandemic trend by the second quarter of 2021. However, household consumption remains below pre-pandemic trend in most other advanced economies, as the recovery in final demand remains incomplete.
Despite Higher Growth, U.S. Inflation is Now Comparable to most other major Advanced Economies
Faster output growth in the United States has been accompanied by higher inflation, but inflation rates have been rising rapidly in Canada, the UK, and the Eurozone as well. Headline inflation rates (on a harmonized basis) are running at approximately 9 percent in both the U.S. and UK, nearly 8 percent for Germany, 7 percent for the Eurozone and close to 7 percent for Canada.2 Inflation rates have come up quickly in Europe over the first four months of 2022 due a combination of high natural gas prices and the restart of the European economy after tight Covid restrictions during the Delta and Omicron waves.
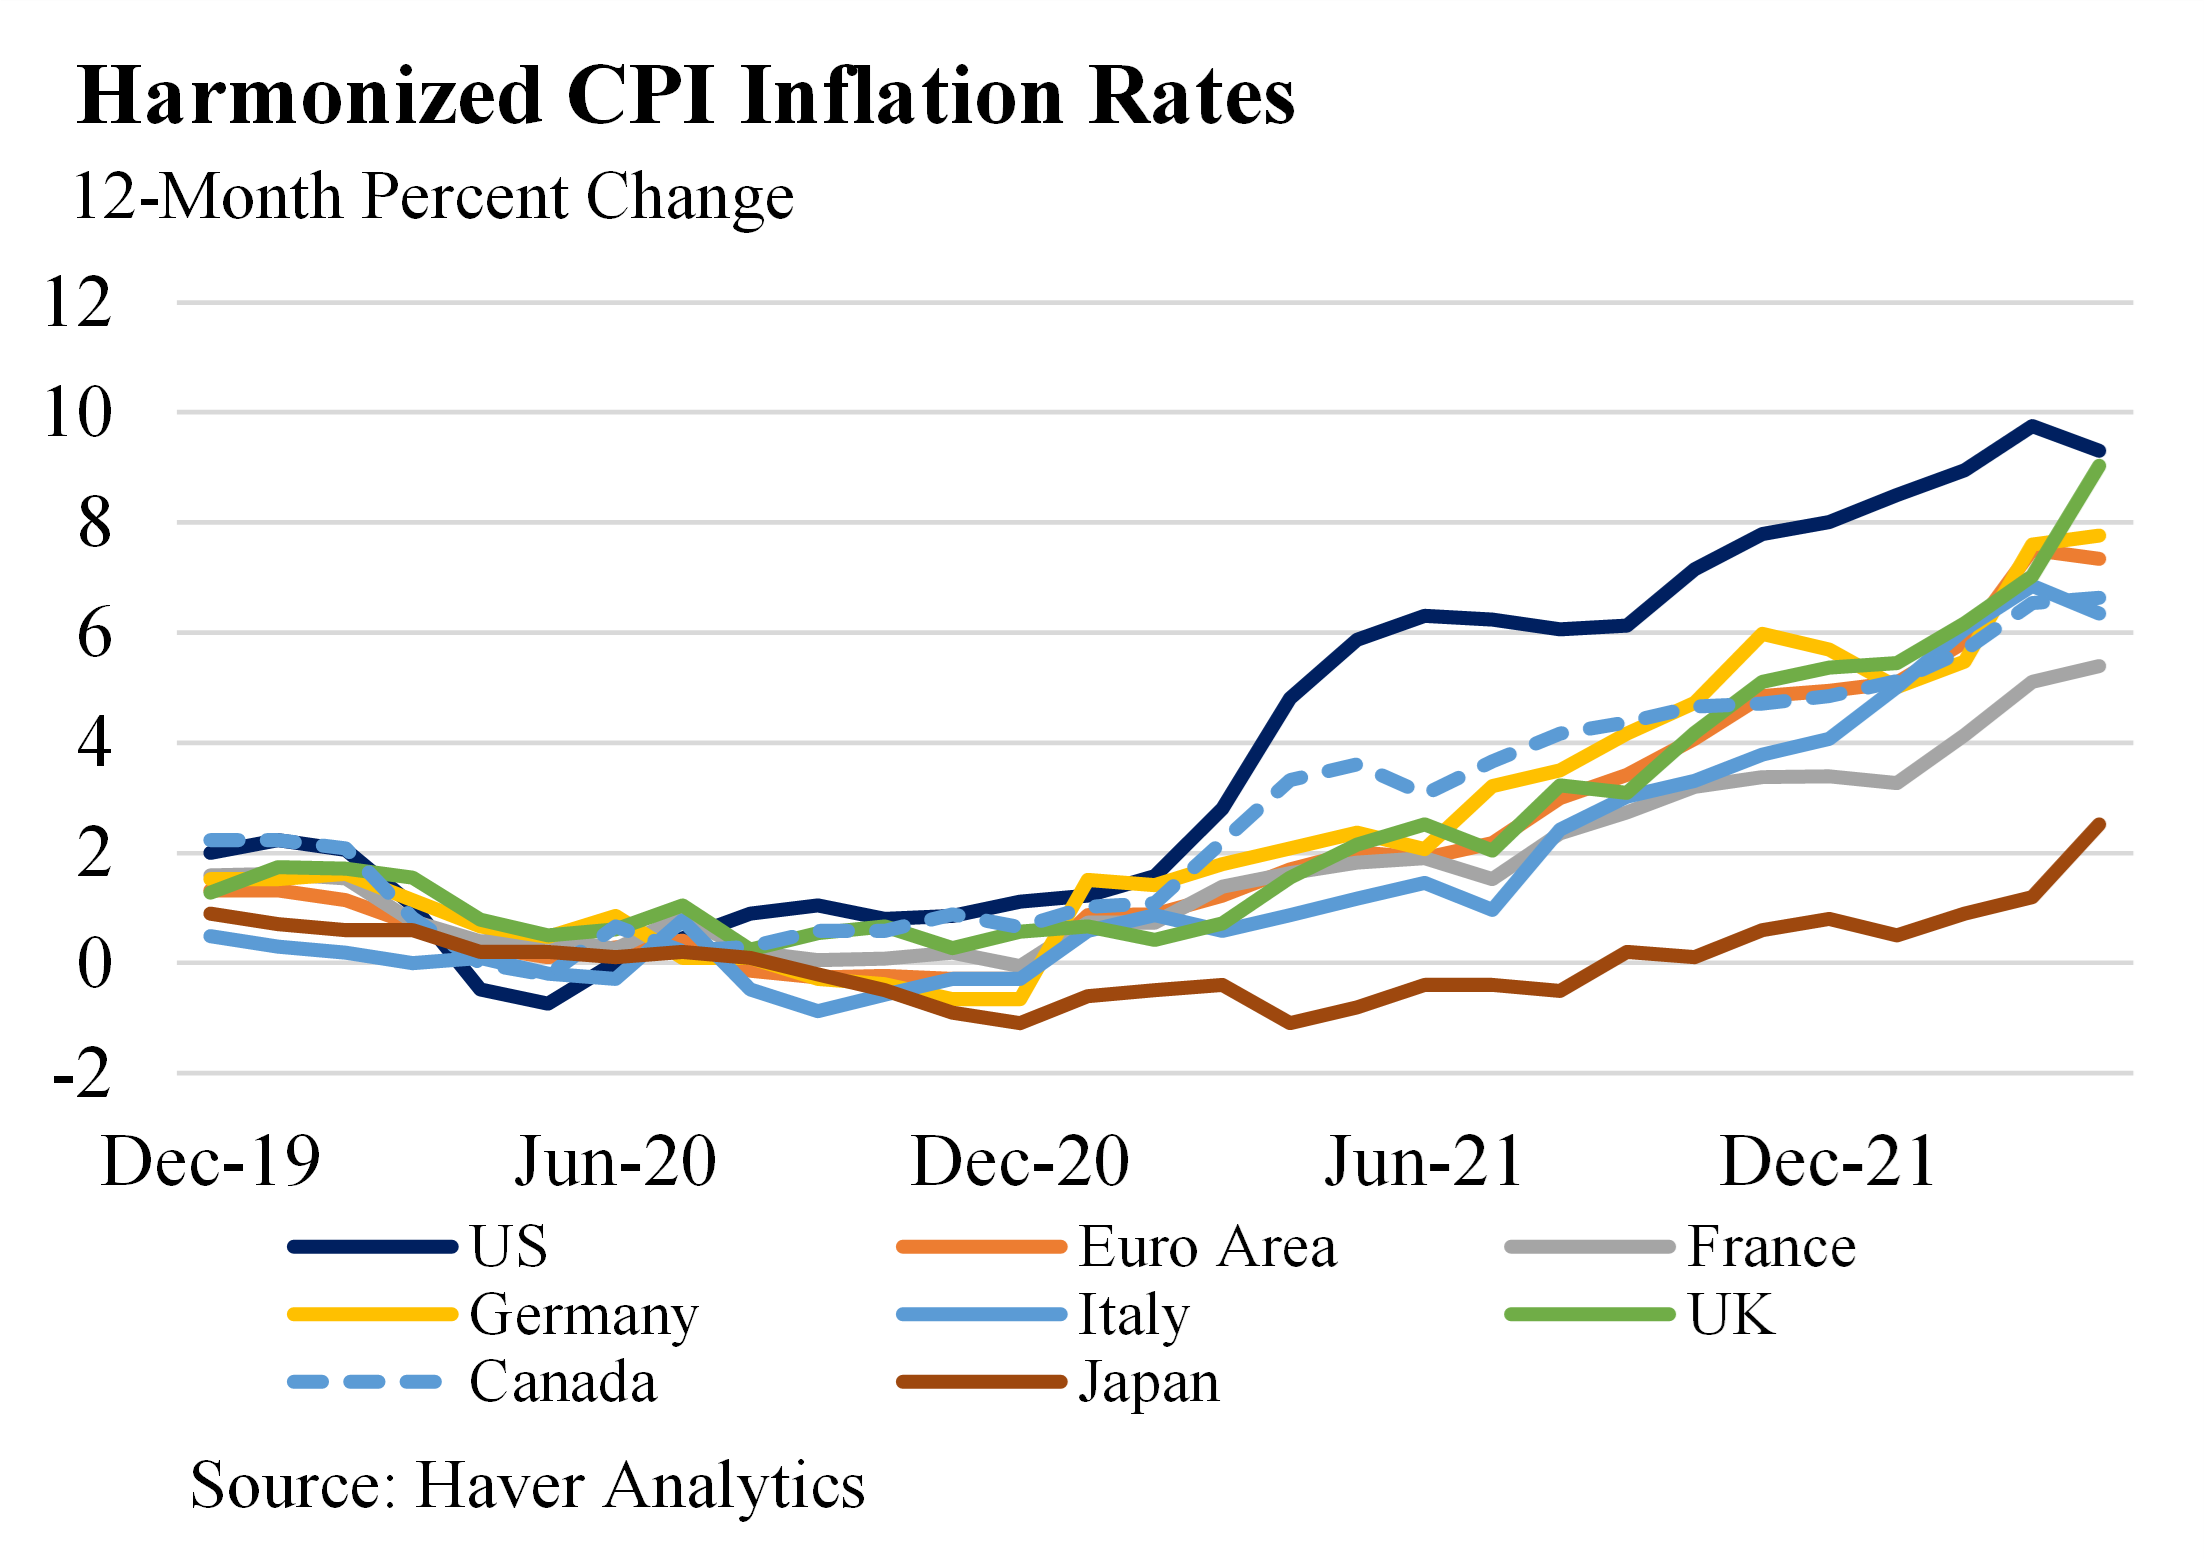
A greater share of inflation in Europe has been attributed to energy, reflecting the fact that oil is a globally traded commodity and European natural gas and electricity prices have risen more sharply than in the US. On a harmonized basis, core inflation (i.e., inflation excluding food and energy) is at 4 percent in Germany and the Eurozone compared to just under 7 percent in U.S. Canadian core inflation (not available on a harmonized basis) is at 4.5 percent. Like overall inflation, core inflation rates have risen more quickly in recent months coinciding with a broader reopening of the economy. Relative to the US, both Europe and Canada had imposed stronger Covid restrictions through 2021, manifesting in a slower recovery in GDP growth, a greater output gap, and less core inflation.3
The U.S. Employment Recovery has Been Exceptionally Strong
Employment statistics appear to show striking differences across G7 economies during the Covid-era. For instance, the United States and Canada had their unemployment rates skyrocket in April and May 2020 – up 11.1 and 7.6 percentage points from December 2019, respectively – while many European unemployment rates stayed relatively flat. In fact, in France and Italy unemployment rates fell markedly in the initial months of the pandemic.
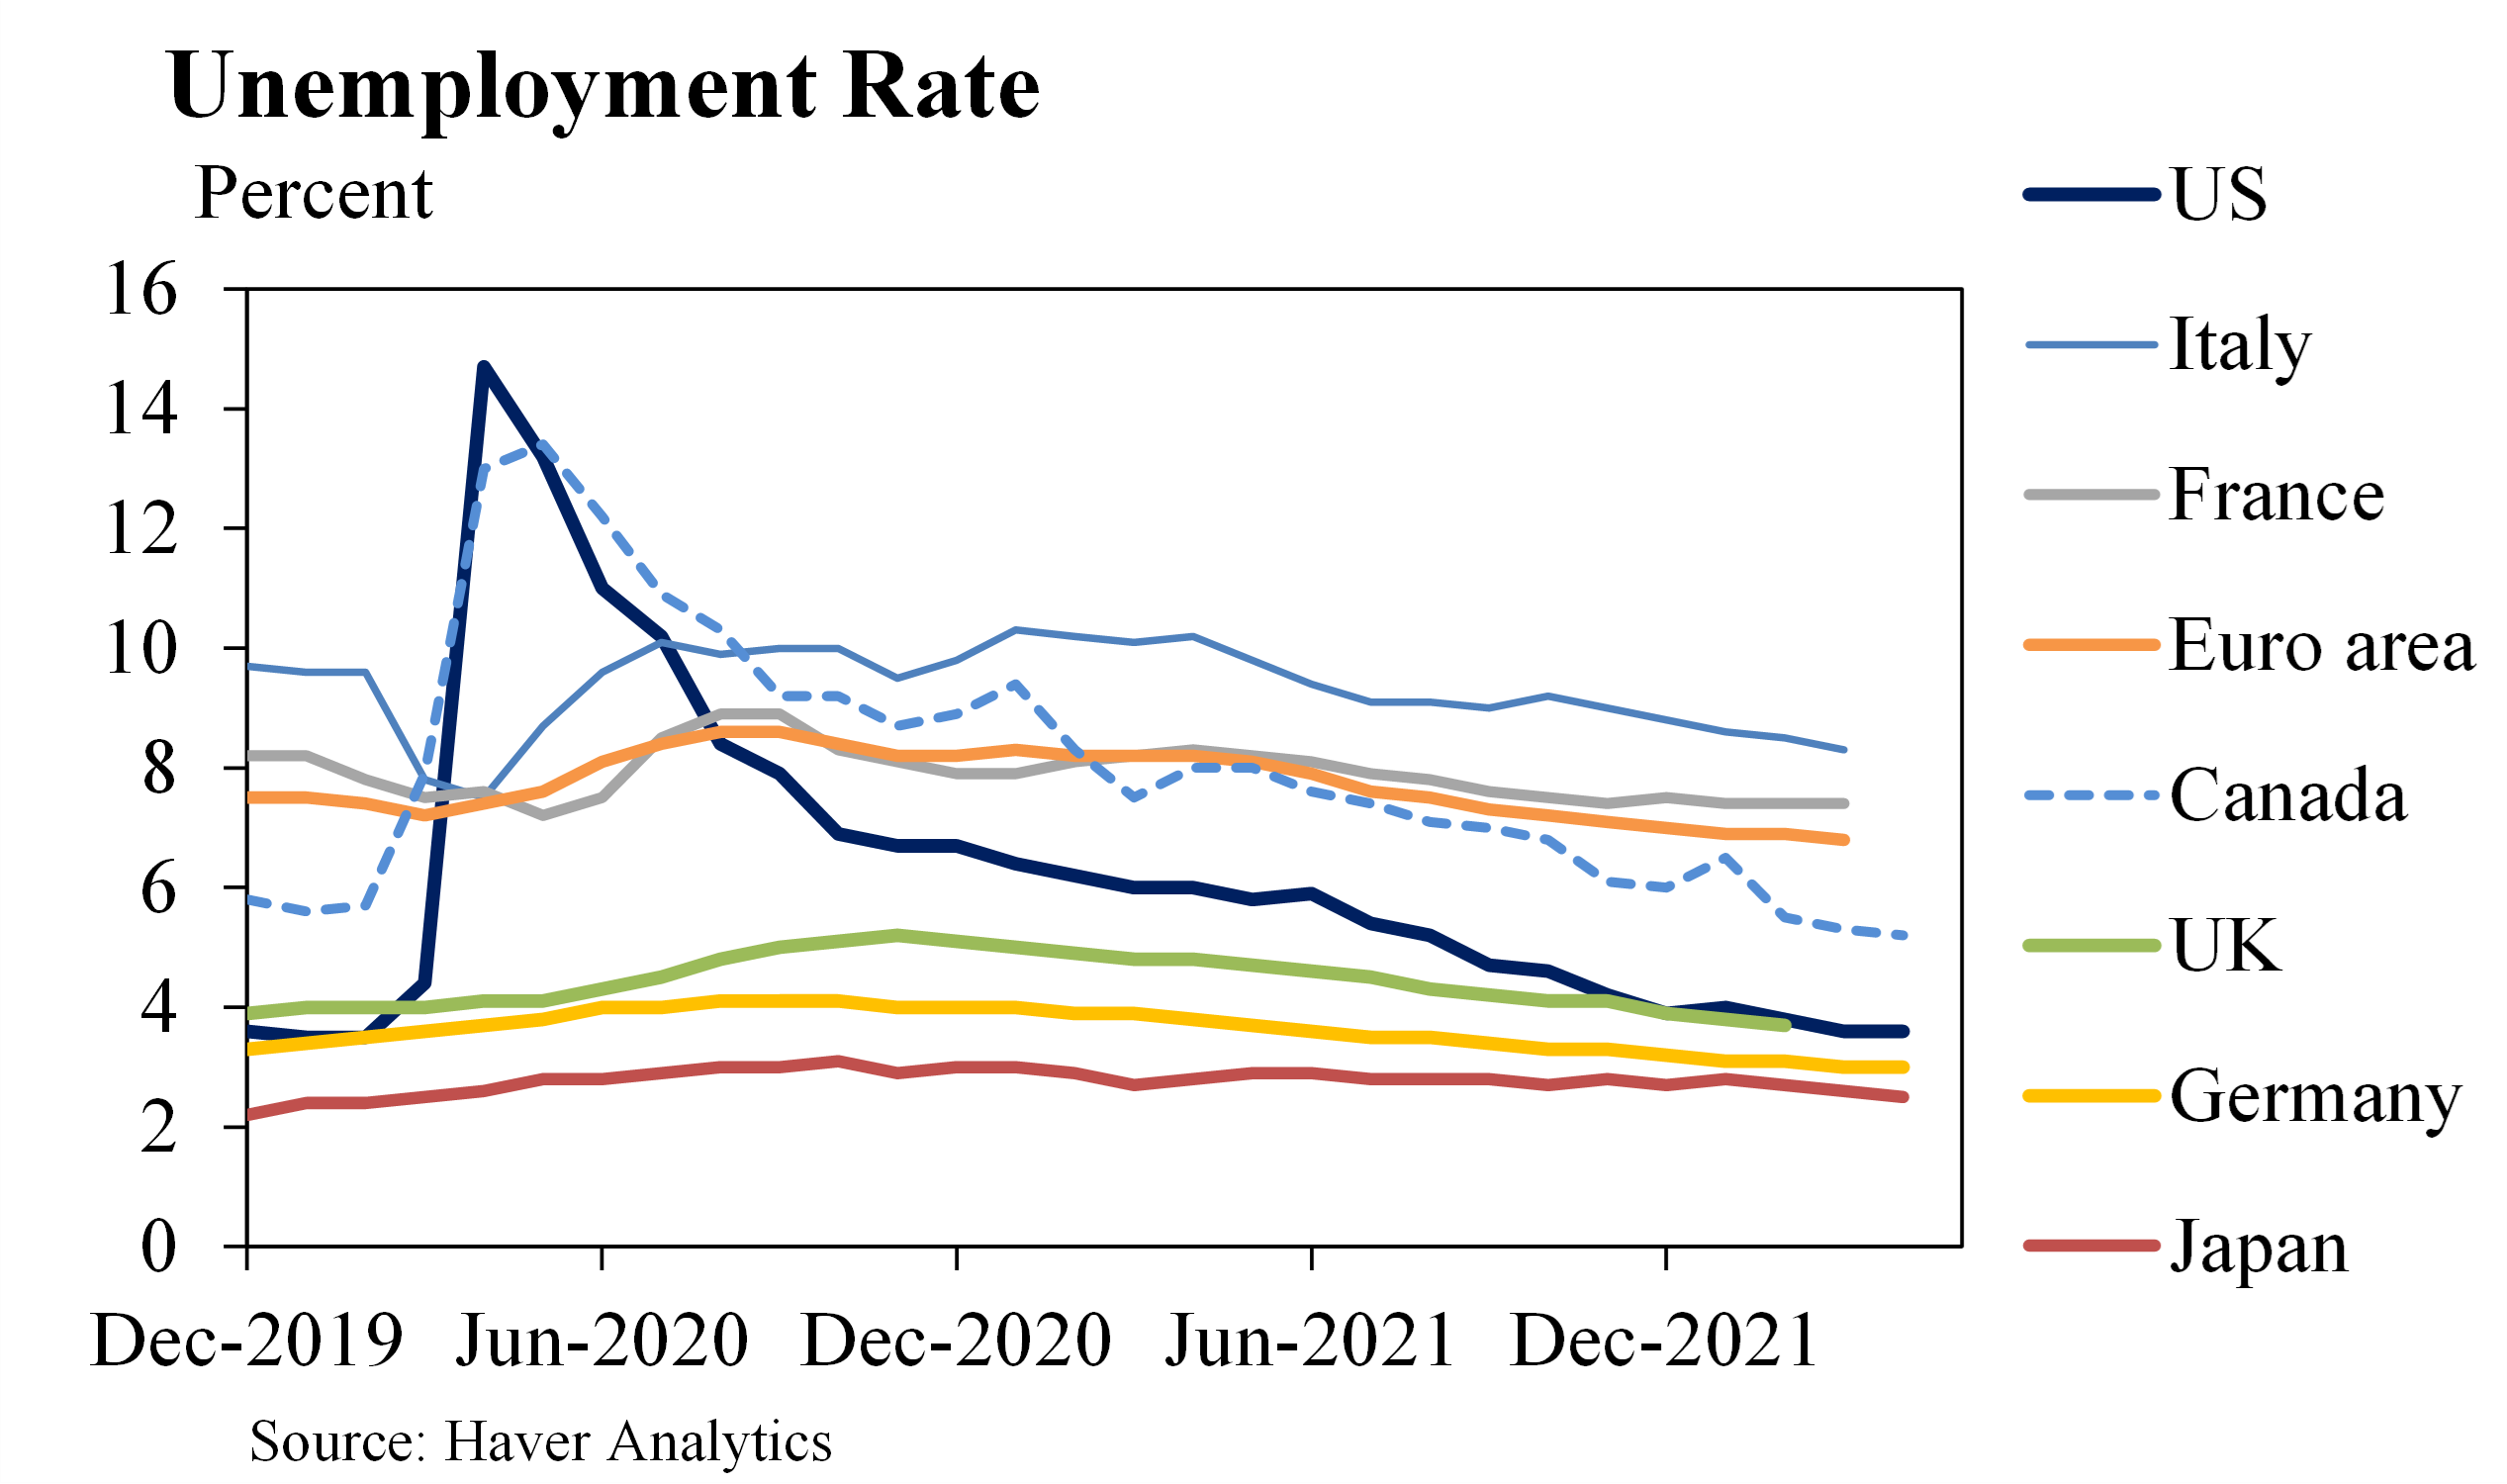
Despite initial impressions, this did not reflect significant divergence in labor activity. Rather, these trends reflect differences across national labor institutions. Each government used their existing institutions to support workers and businesses through the initial covid shutdown. In the United States and Canada, unemployment insurance was most suited to rapid, large-scale support. Many European economies also leveraged their social safety nets, often in a way that led to continued employment in official statistics – analogous to the United States’ little-used Workshare program.
The official statistics of most other G7 economies do not show a sharp rise in the unemployment rate in the spring 2020, nor a corresponding robust recovery. Again, this is partially a result of differing labor market institutions and pandemic-era policies, rather than a reflection of underlying differences in labor activity. The United States now has an unemployment rate sitting just 0.1 percentage point above its 50-year low. Germany has seen similar lows, while Canada and the UK are also near their lows.
The similar recovery in employment despite disparate recoveries in output has implications for labor productivity. U.S. labor productivity has outpaced labor productivity growth in Europe and Japan. Here, labor market policies may be playing a role. The U.S. system based on unemployment insurance may have allowed for greater labor reallocation relative to systems that preserved employer attachment. In general, U.S. employment has reallocated from lower wage industries to high wage/higher productivity industries. U.S. employment has also shifted to industries with higher average hours worked, implying a stronger recovery in hours relative to employment. This reallocation of labor may drive further gains in labor productivity going forward.
Rapid Economic Growth has led to Especially Rapid Improvement in the U.S. Fiscal Position
The U.S. fiscal position has improved faster than most other advanced economies due to the speed of the U.S. recovery. The deficit is projected by the most recent CBO forecast to drop by $1.7 trillion between FY 2021 and FY 2022 – the fastest decline in the deficit on record. The deficit in the first quarter of 2022 fell to just 1.4 percent of GDP as tax revenues have surged in the US.

As the figure shows, U.S. deficits during the pandemic were generally higher reflecting a broader and stronger fiscal response. However, deficits have contracted more quickly in late 2021 and early 2022 as pandemic support largely ended by the third quarter of 2021. The CBO’s most recent budget projections see the deficit falling to 4 percent of GDP and remaining near that – well below both pandemic levels and below even the Administration’s estimates for the FY 2023 budget.
The U.S. is Better Positioned than many countries to Endure Commodity Shocks
In all likelihood, the US is better positioned than its major partners to weather the impact of high energy and other commodity prices. As a major producer of crude oil, petroleum products and natural gas, the U.S. experiences a more muted impact on its growth from higher energy prices. While elevated energy prices negatively impact consumer disposable income in a similar way across advanced economies, the growth impacts are mitigated for the US because high prices incentivize increased investment in energy production. Other mitigating factors include stronger export growth of energy products and a beneficial impact on the terms of trade (price of exports relative to price of imports).
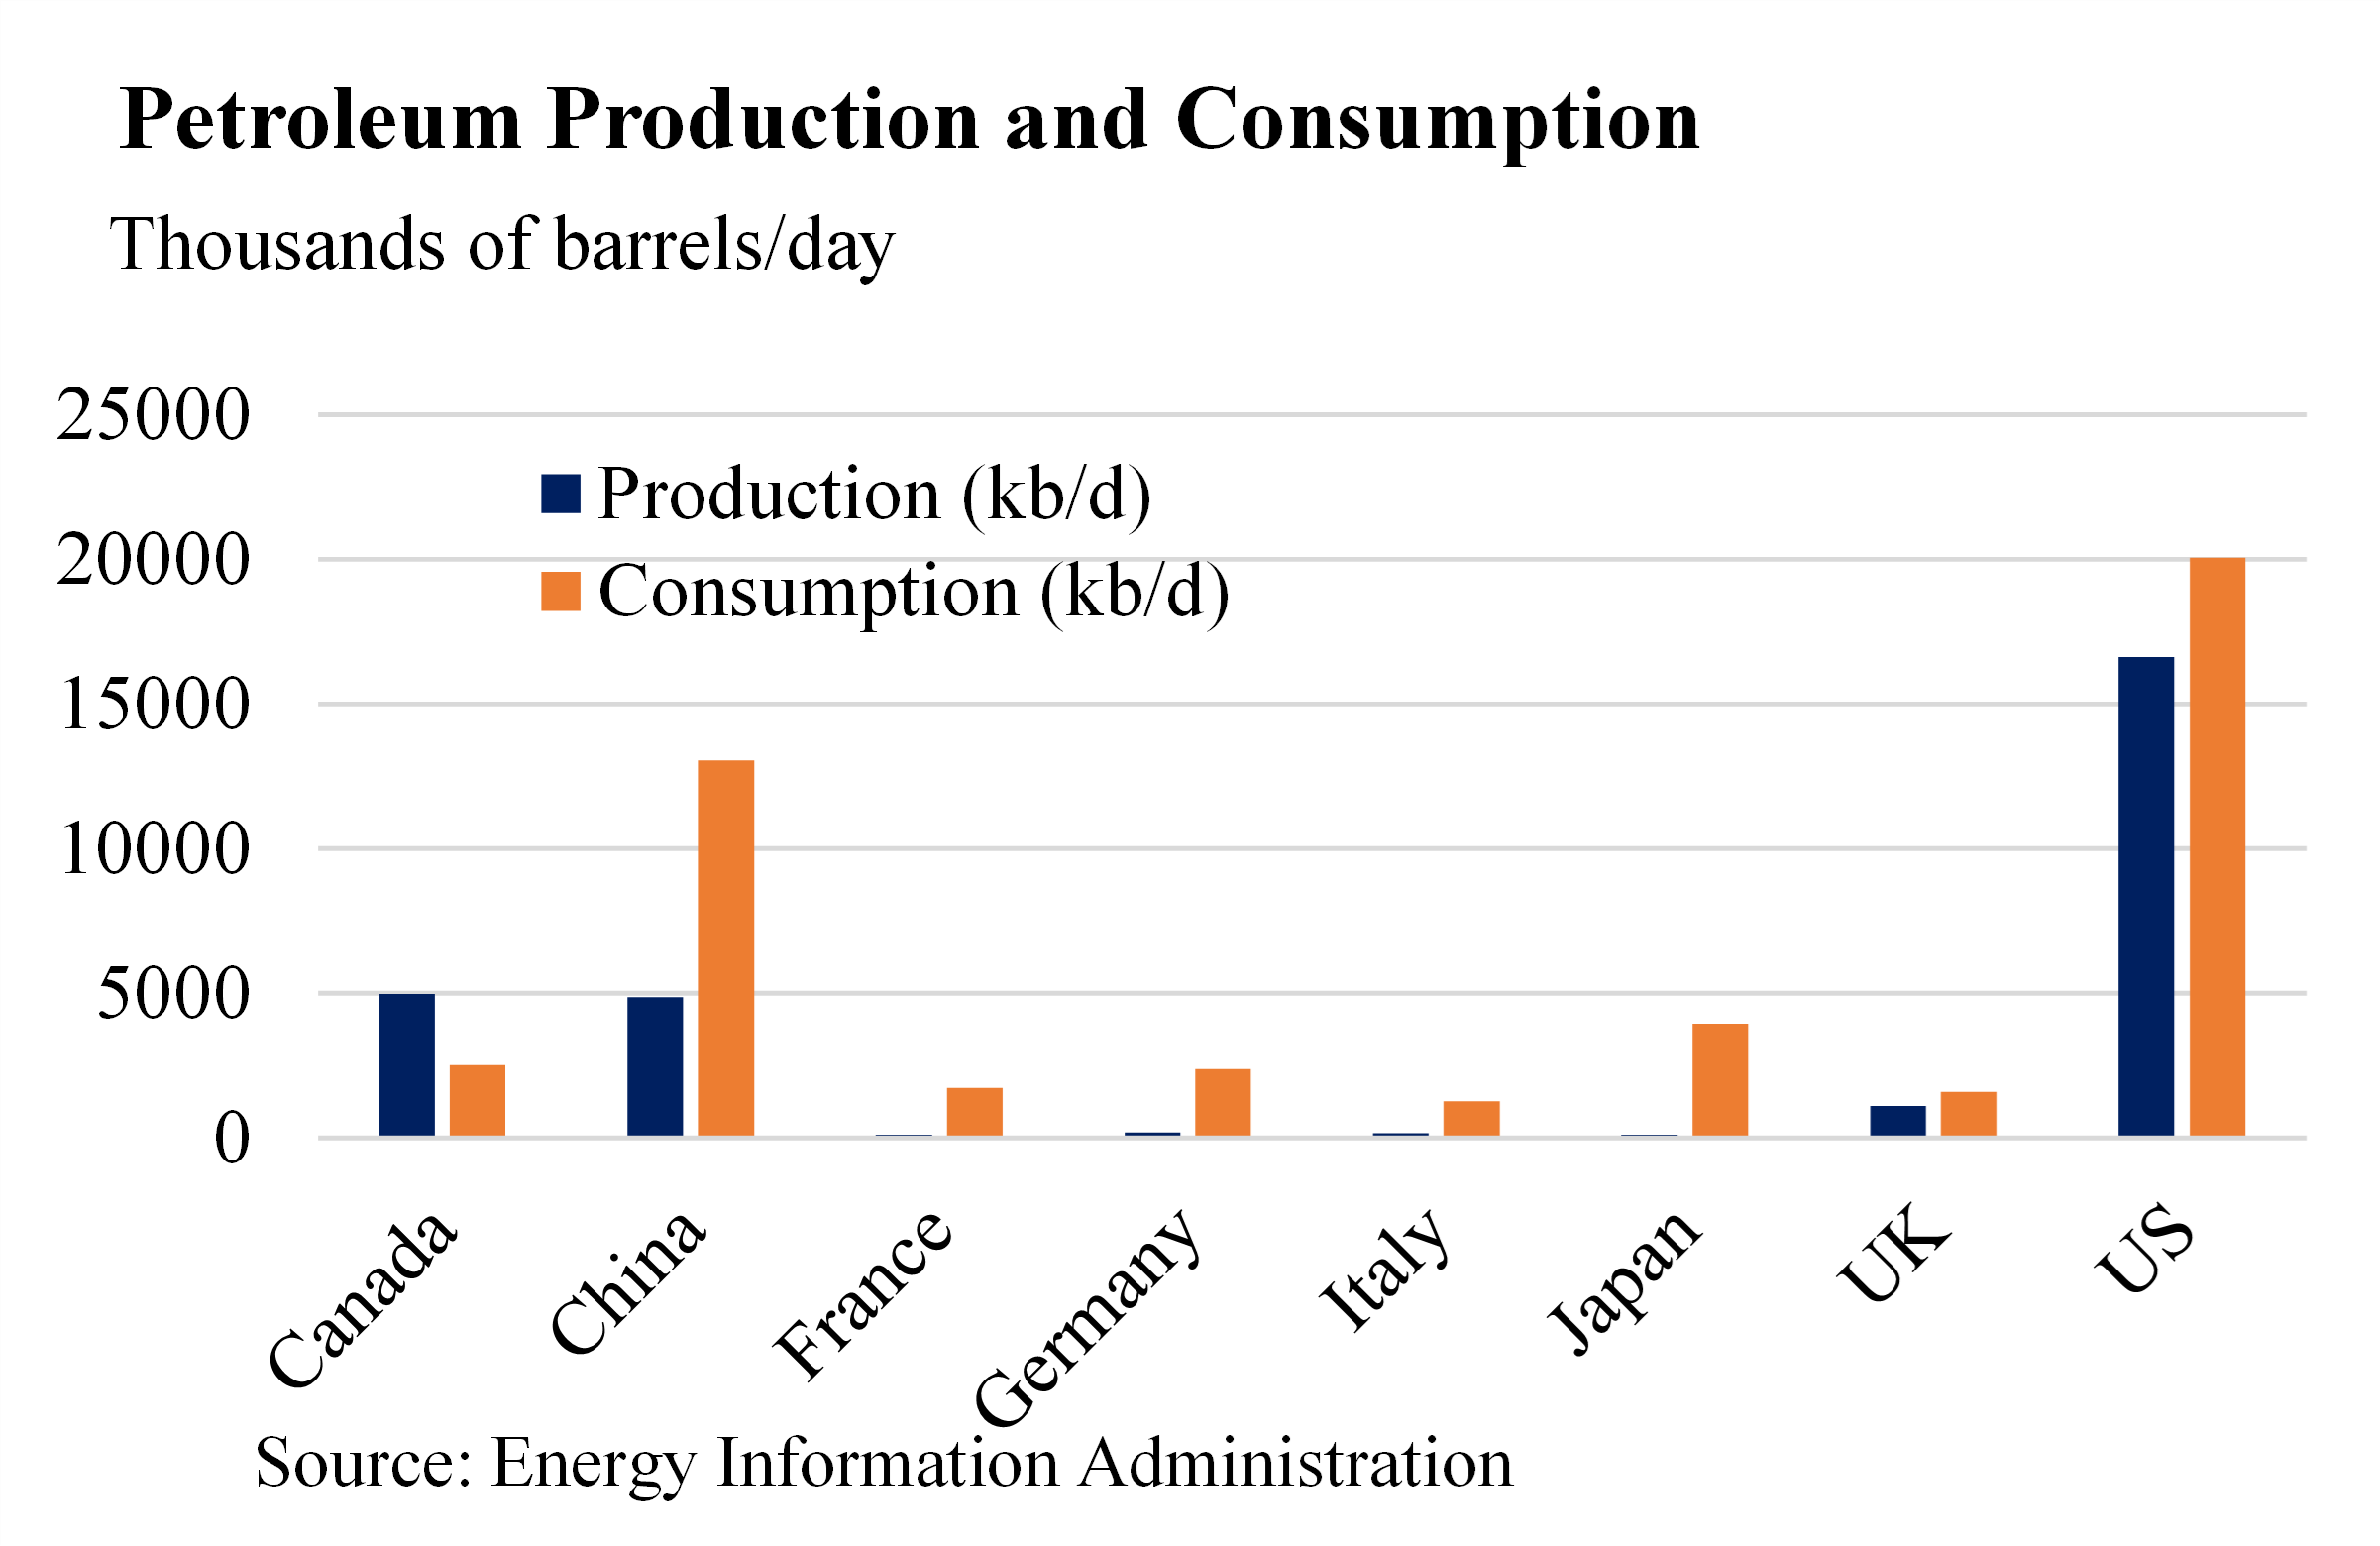
The figure shows petroleum consumption and production for the US, the G7 and China, taking averages from 2015-2019 as reported by the Energy Information Administration (EIA). With the exception of Canada, each economy consumes more than it produces and relies on imports from major producers like Russia and Saudi Arabia. While the US is a modest net importer of crude oil, U.S. production is significant and insulates the U.S. economy from energy price shocks. Major European economies, as well as Japan and China are highly reliant on imports; as prices rise, import prices rise and in addition, lower production in energy-consuming industries is not offset by higher production in energy-producing industries.
[1] Gross domestic income (GDI) measures wages, profits, rental income and should conceptually be equal to gross domestic product. However, GDI and GDP can diverge due to differences in source data. Using gross domestic output – the average between GDI and GDP – is considered best practice in estimating output growth. For further discussion of GDI v. GDP see our blog: https://home.treasury.gov/news/featured-stories/measuring-the-strength-of-the-recovery
[2] Harmonized inflation ensures comparability between US and European inflation measurement; the US harmonized inflation rate is produced by the Bureau of Labor Statistics. Harmonized inflation not available for Canada and Japan; headline CPI inflation shown for both countries.
[3] Longer-term inflation expectations as measured in household surveys or via market measures have shifted much less than short-term inflation expectations, suggesting that inflation expectations remain anchored.