
Eric Van Nostrand, Assistant Secretary for Economic Policy (P.D.O.)
Much economic commentary focuses on the historically strong job market, which has supported solid consumer spending and overall growth. But another key component of a healthy economy—one that tends to be more forward looking than consumer spending—is business investment. For a prosperous corporate sector to truly benefit families and workers, businesses must feel confident investing their profits to generate new jobs, opportunities, and innovations. American businesses are doing well not simply because their earnings are high, but because they are investing those earnings productively.
Creating favorable conditions for business investment is central to President Biden’s economic agenda. The CHIPS & Science Act and Inflation Reduction Act explicitly encourage private investment, while other Administration efforts increase competition and reduce barriers to entry for new firms. Business investment strengthens our economy’s long-run productivity while creating space for higher-quality jobs. This blog reviews the progress of U.S. business investment since the pandemic. Our key conclusions:
- American business investment is outperforming expectations in the post-pandemic expansion; businesses have invested $430 billion more this cycle than if investment followed historical patterns. Despite high interest rates that increase firms’ borrowing costs, real U.S. business investment has outperformed three key benchmarks: typical behavior in economic expansions, post-COVID consensus forecasts, and the conventional accelerator models that economists use to forecast investment.
- Factory building (construction for manufacturing) has contributed almost one third of business investment growth since the pandemic. This is a departure from the norm: manufacturing construction did not contribute to business investment growth on average from 1973 to 2021. Intellectual property investment has also grown, while conventional equipment investment has slowed. With factory building concentrated in the computer, electrical, and electronic category that includes semiconductors and electric vehicle batteries, the CHIPS Act and the Inflation Reduction Act are likely drivers.
- The outlook for future business investment growth is encouraging: firms are observing persistently high returns to their capital, and founders are starting new businesses at historic rates. Today’s persistently high returns to capital give businesses confidence that their investments will pay off in the future and weaken the argument that public investments are crowding out private capital. Business founders are showing confidence in the investment outlook, as applications for new businesses surge above pre-pandemic rates.
Post-COVID Business Investment Growth
U.S. real non-residential fixed investment (“business investment” hereafter) has grown at a relatively consistent rate of 4-6 percent per year since 2021, largely consistent with the pre-COVID business cycle. But despite the consistency with the historical trend, post-COVID business investment growth has outperformed three key benchmarks: historical business cycle behavior, economists’ forecasts, and economic modeling.
Because the 4-6 percent figure alone is not especially high by historical standards, a casual observer might be forgiven for characterizing that investment growth as middling. Indeed, the pre-pandemic conversation around business investment focused heavily on a global slump relative to history and expectations.1
But the macroeconomic context after the pandemic is considerably different, and would normally lead one to expect lower investment. Theoretically, high interest rates raise firms’ borrowing costs and are typically expected to slow investment growth. Higher uncertainty around macroeconomic forecasts in the post-pandemic expansion should also have slowed investment. But instead, business investment growth has maintained its historical strength.
First, the historical benchmark. Figure 1 shows business fixed investment as a share of GDP since the COVID business cycle peak (blue), compared with the analogous period in the Great Recession and Recovery (orange), and the average behavior in all U.S. business cycles since 1971 (dotted). Typically, investment tends to fall as a percent of GDP in a recession and to continue to contribute less well into the recovery. This was especially the case in the 2008 Great Recession, when business investment as percent of GDP fell by more than 2 percentage points. In recent years, business investment has bucked that trend, remaining at roughly the same share of GDP since before COVID: a better outcome than after every other recession since 1980. Indeed, in this cycle, American businesses invested $430 billion more than if overall growth had been the same but investment followed its usual historical pattern.2
Figure 1

Notes: Business cycle peaks are the National Bureau of Economic Research’s quarterly business cycle peaks. “Business fixed investment” is private nonresidential fixed investment.
Source: Bureau of Economic Analysis; National Bureau of Economic Research; U.S. Treasury calculations.
A second benchmark: what did economic forecasters expect for business investment growth earlier in the cycle? Figure 2 shows actual calendar-year growth in business investment (blue bars) for 2022-2024, alongside the Blue Chip consensus forecasts for October 2022 (green bars). In October 2022, the Federal Reserve’s interest rate hikes were well underway and markets expected persistently higher rates. Actual business investment growth outperformed each of these forecasts from 2022 to 2024 to date.
Figure 2
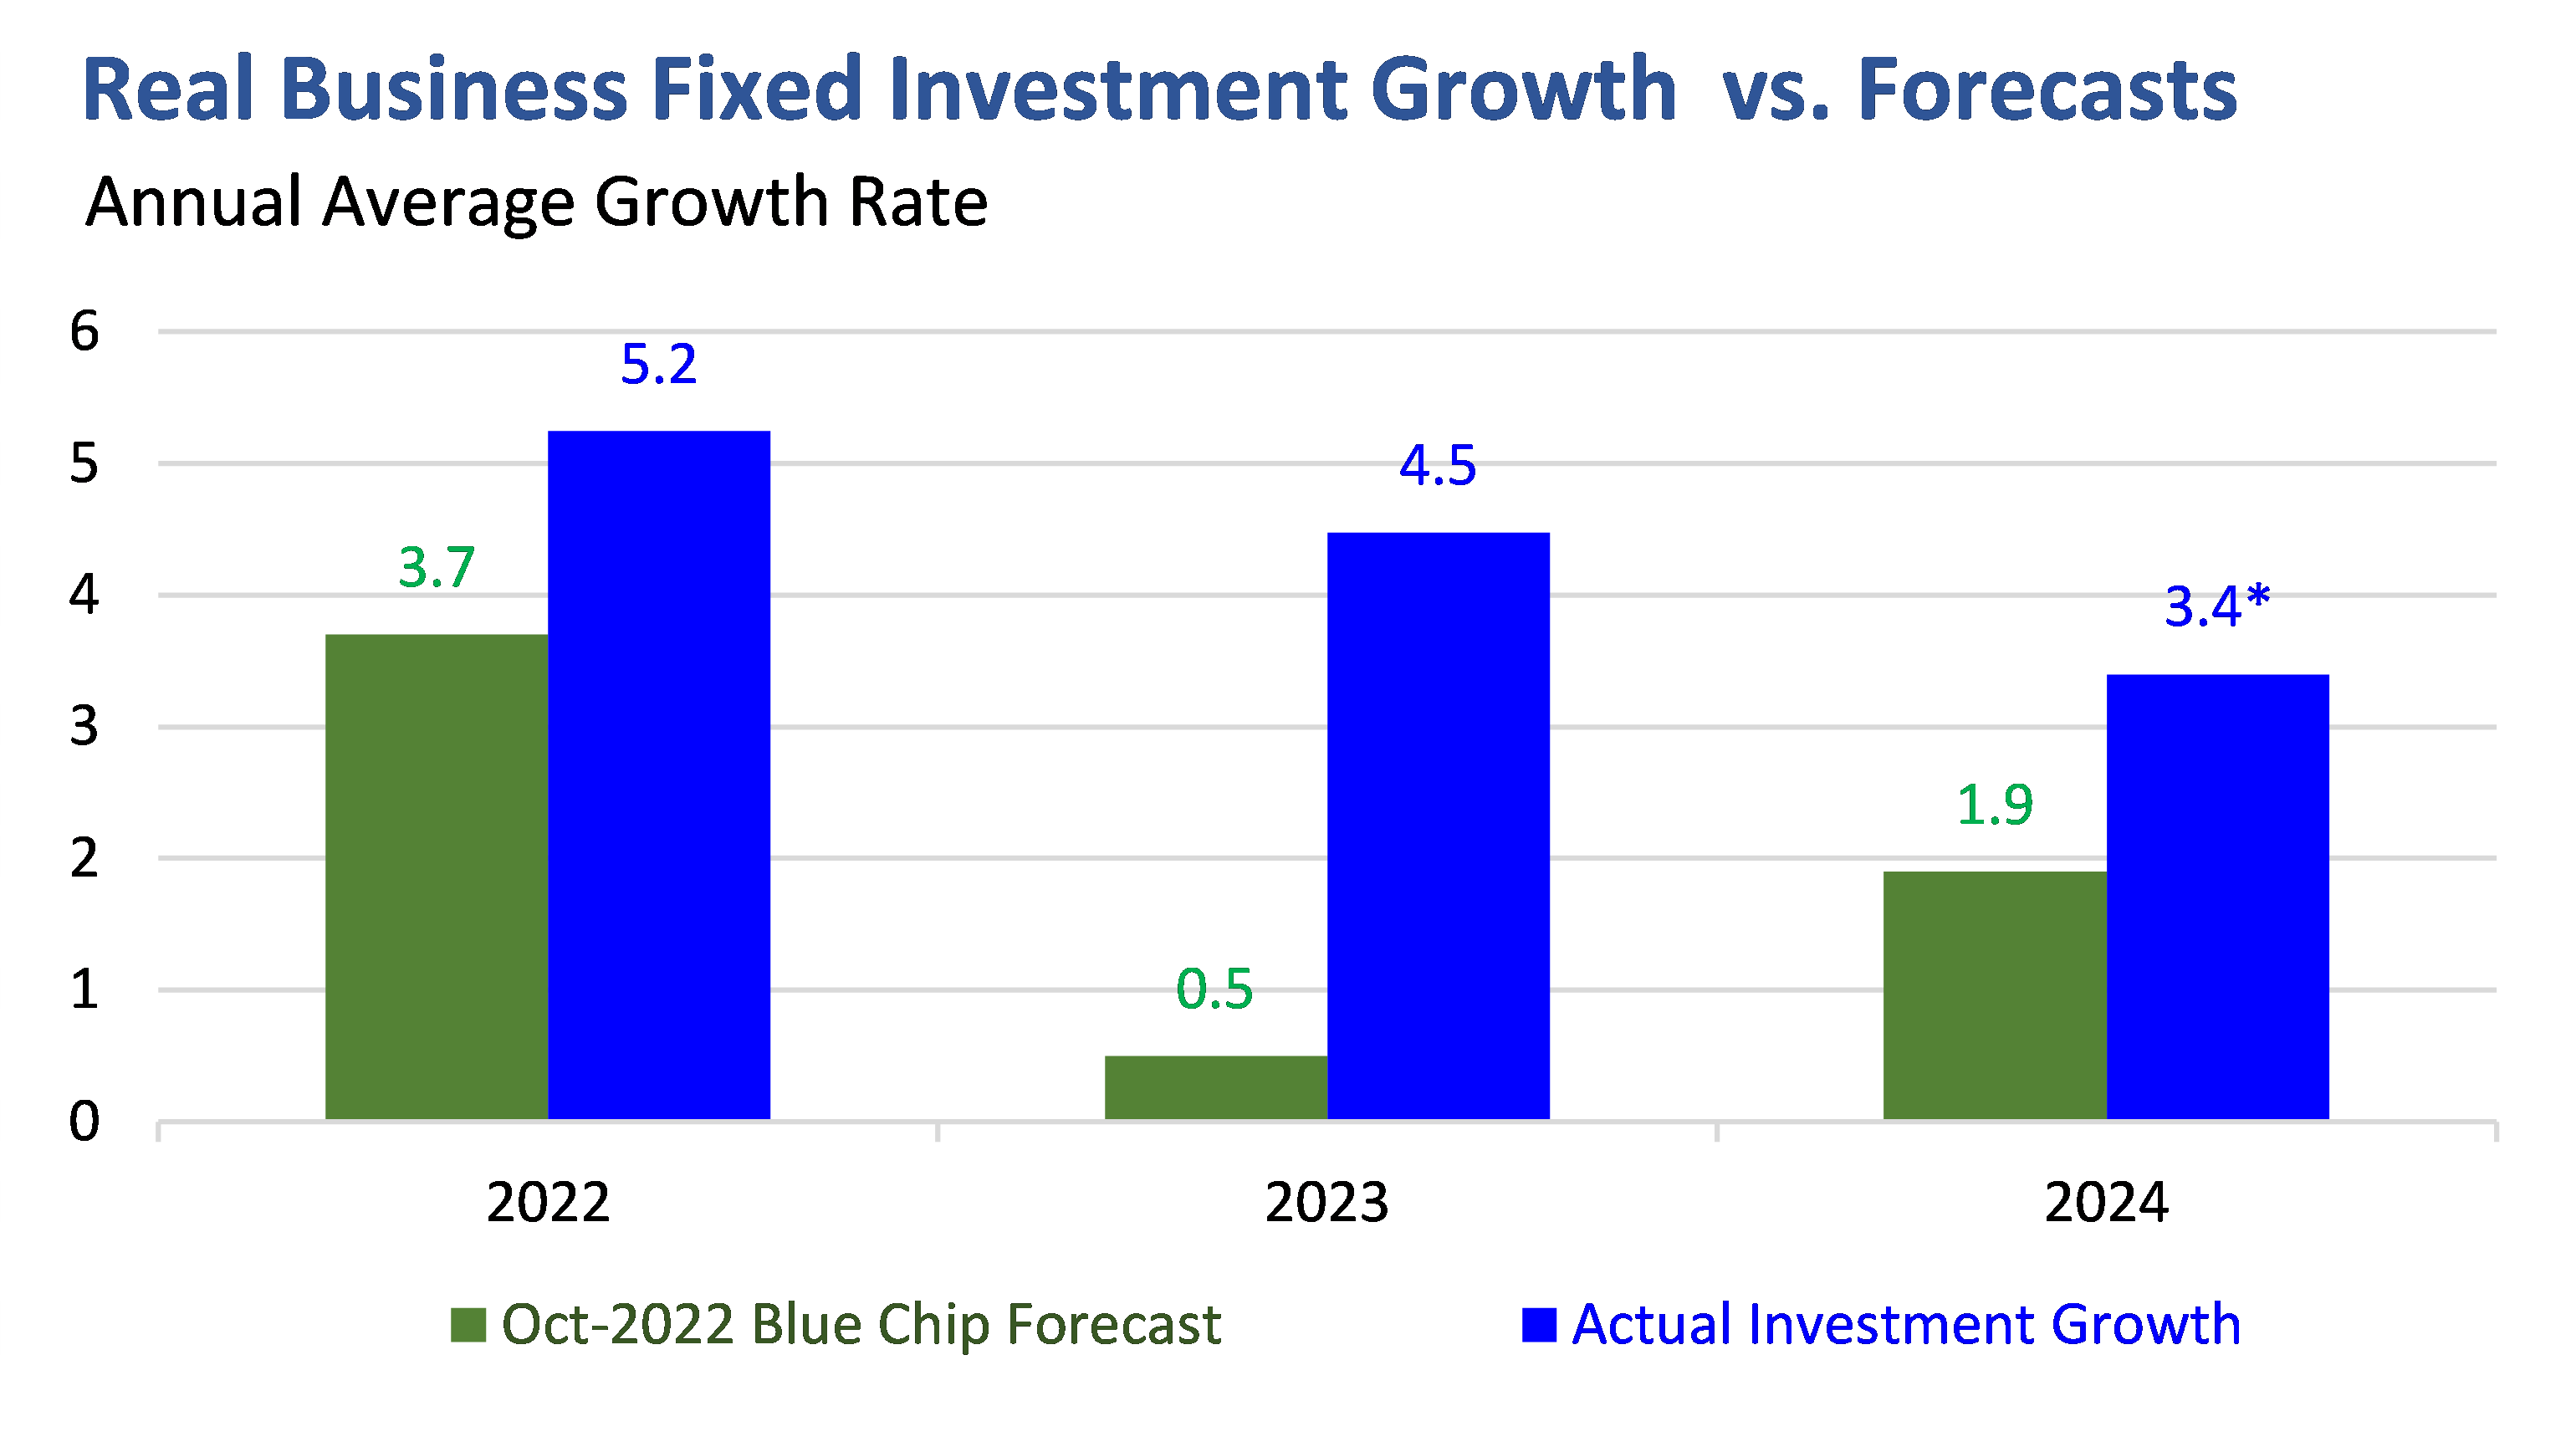
Notes: Actual Investment Growth reflects the actual annual average growth rate in private nonresidential fixed investment. Blue Chip Forecasts are the consensus forecast for the same reported by Blue Chip Economic Indicators in October 2019 and October 2022. *For 2024, an estimate of actual growth is shown assuming that the reported growth rate in the first quarter of 2024 persists throughout the year.
Source: Bureau of Economic Analysis; Blue Chip Economic Indicators.
A third benchmark: what can we learn from the conventional modeling tools economists use to understand the drivers of business investment? These models form the basis for the forecasts described above, but by examining their details we can see which economic variables are responsible for the investment's faster-than-forecast recovery after the pandemic. Figure 3 compares business investment growth with the output of a conventional “accelerator model,” a concept first proposed by Alvin Hansen in 1938.3 Accelerator models hold that business investment growth is related to changes in overall output growth: that businesses invest more when the economy grows faster. In the immediate pandemic recovery, these models predicted a quick rebound in investment. But since the economy has cooled from that initial burst of growth, the models have called for slower investment growth as shown on the right side of Figure 3. But actual business investment has nonetheless maintained that stable 4-6 percent growth rate.
Figure 3
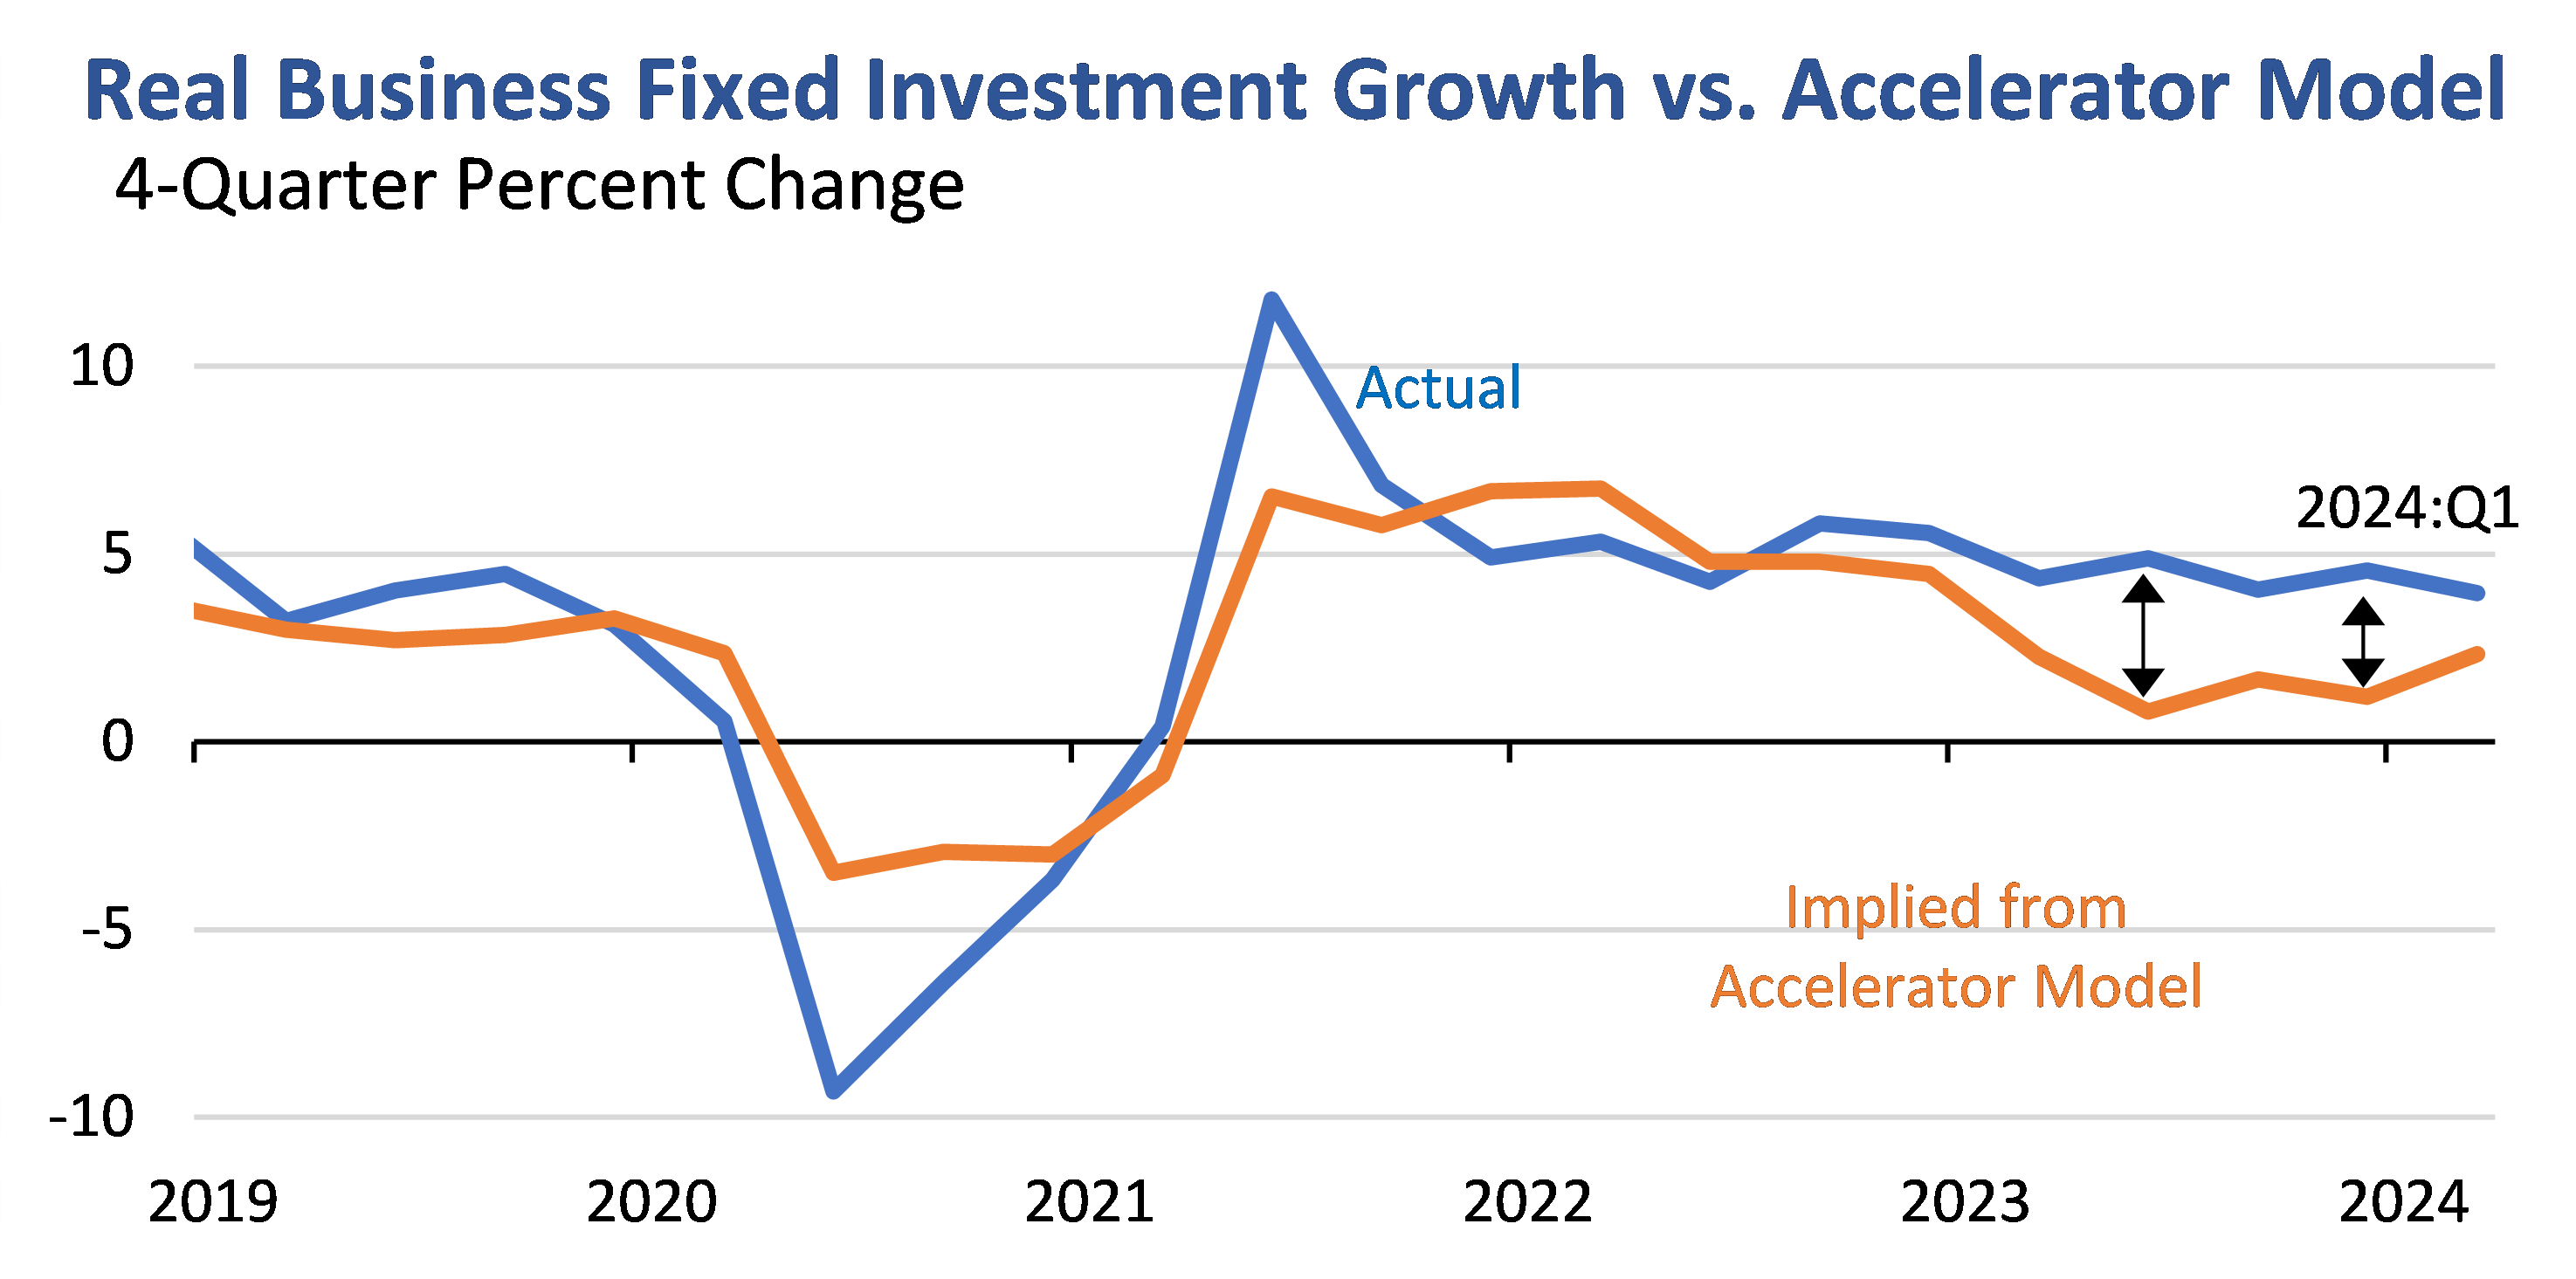
![Notes: The Jorgenson-Siebert(1968) accelerator model for real business investment is estimated as in IMF (2015). Parameters (a,b,d) are estimated for equation I_t/K_(t-1) =a/K_(t-1) +∑_(i=1)^12▒[b_i (ΔY_(t-i))/K_(t-1) ] +d+ε_t, , where I is real private nonresidential fixed investment, K is the real private capital stock, and Y is real GDP, over quarterly data from 1970:Q1-2024:Q1. The orange line presents the four-quarter percent change in fitted values of I. The estimate has an R2=0.81. Source: IMF (2015); Jorgenson-Siebert (1968); U.S. Treasury calculations.](/system/files/136/notes-figure-3-June-12-2024.PNG)
The Role of Factory Construction in Business Investment
To help identify the drivers of historically resilient business investment, Figure 4 shows the contributions to business investment growth over the past few decades by type of investment. Over the 35 years leading up to the Great Recession (left bar) and the 12 years following the Global Financial Crisis, the average composition of business investment growth was largely consistent: significant contributions from investment in equipment and in intellectual property, with some varying contribution from changes in structures investment (construction) in non-manufacturing sectors. Investment in manufacturing structures (factory construction) made no contribution on average. But in recent years the composition of business investment growth looks quite different: factory construction has contributed almost one-third of business investment growth since the end of 2021.
Figure 4
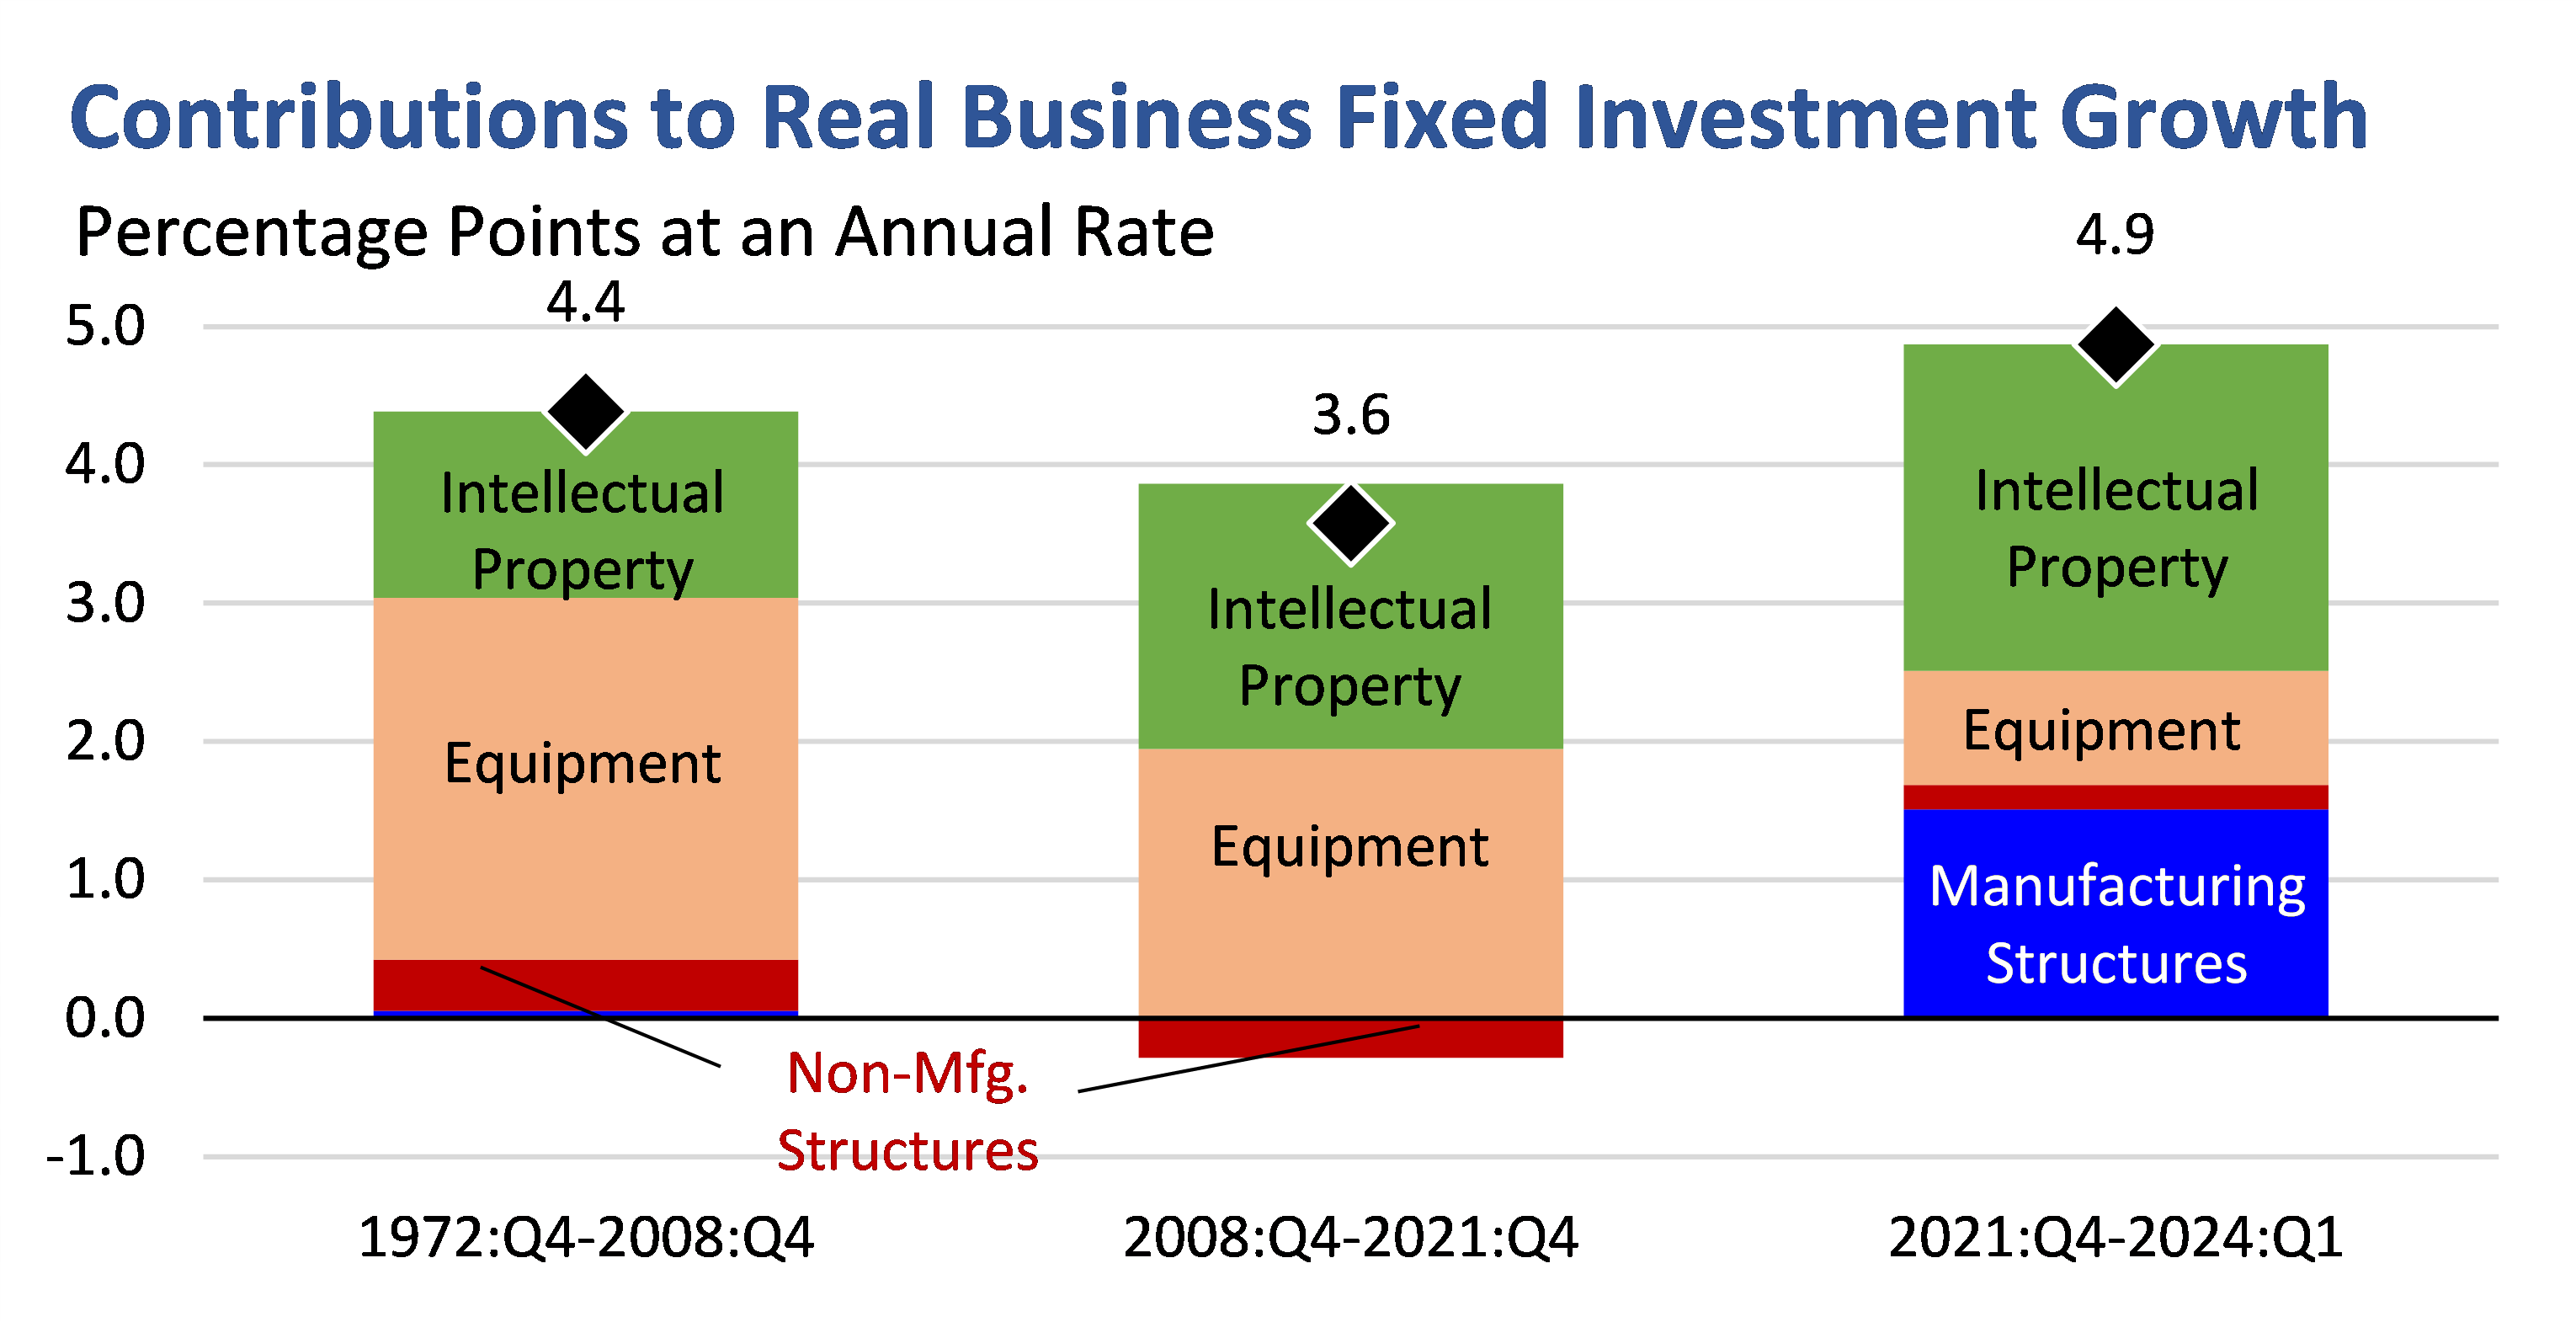
Notes: Growth in private nonresidential fixed investment is decomposed into contributions from equipment, intellectual property, manufacturing structures, and other structures over the indicated time periods. Contributions are inferred from the given subcomponents’ published contributions to private fixed investment growth, and then scaled by the ratio of private nonresidential fixed investment growth (BFI growth) to BFI growth’s contribution to overall private fixed investment growth.
Source: Bureau of Economic Analysis; U.S. Treasury calculations.
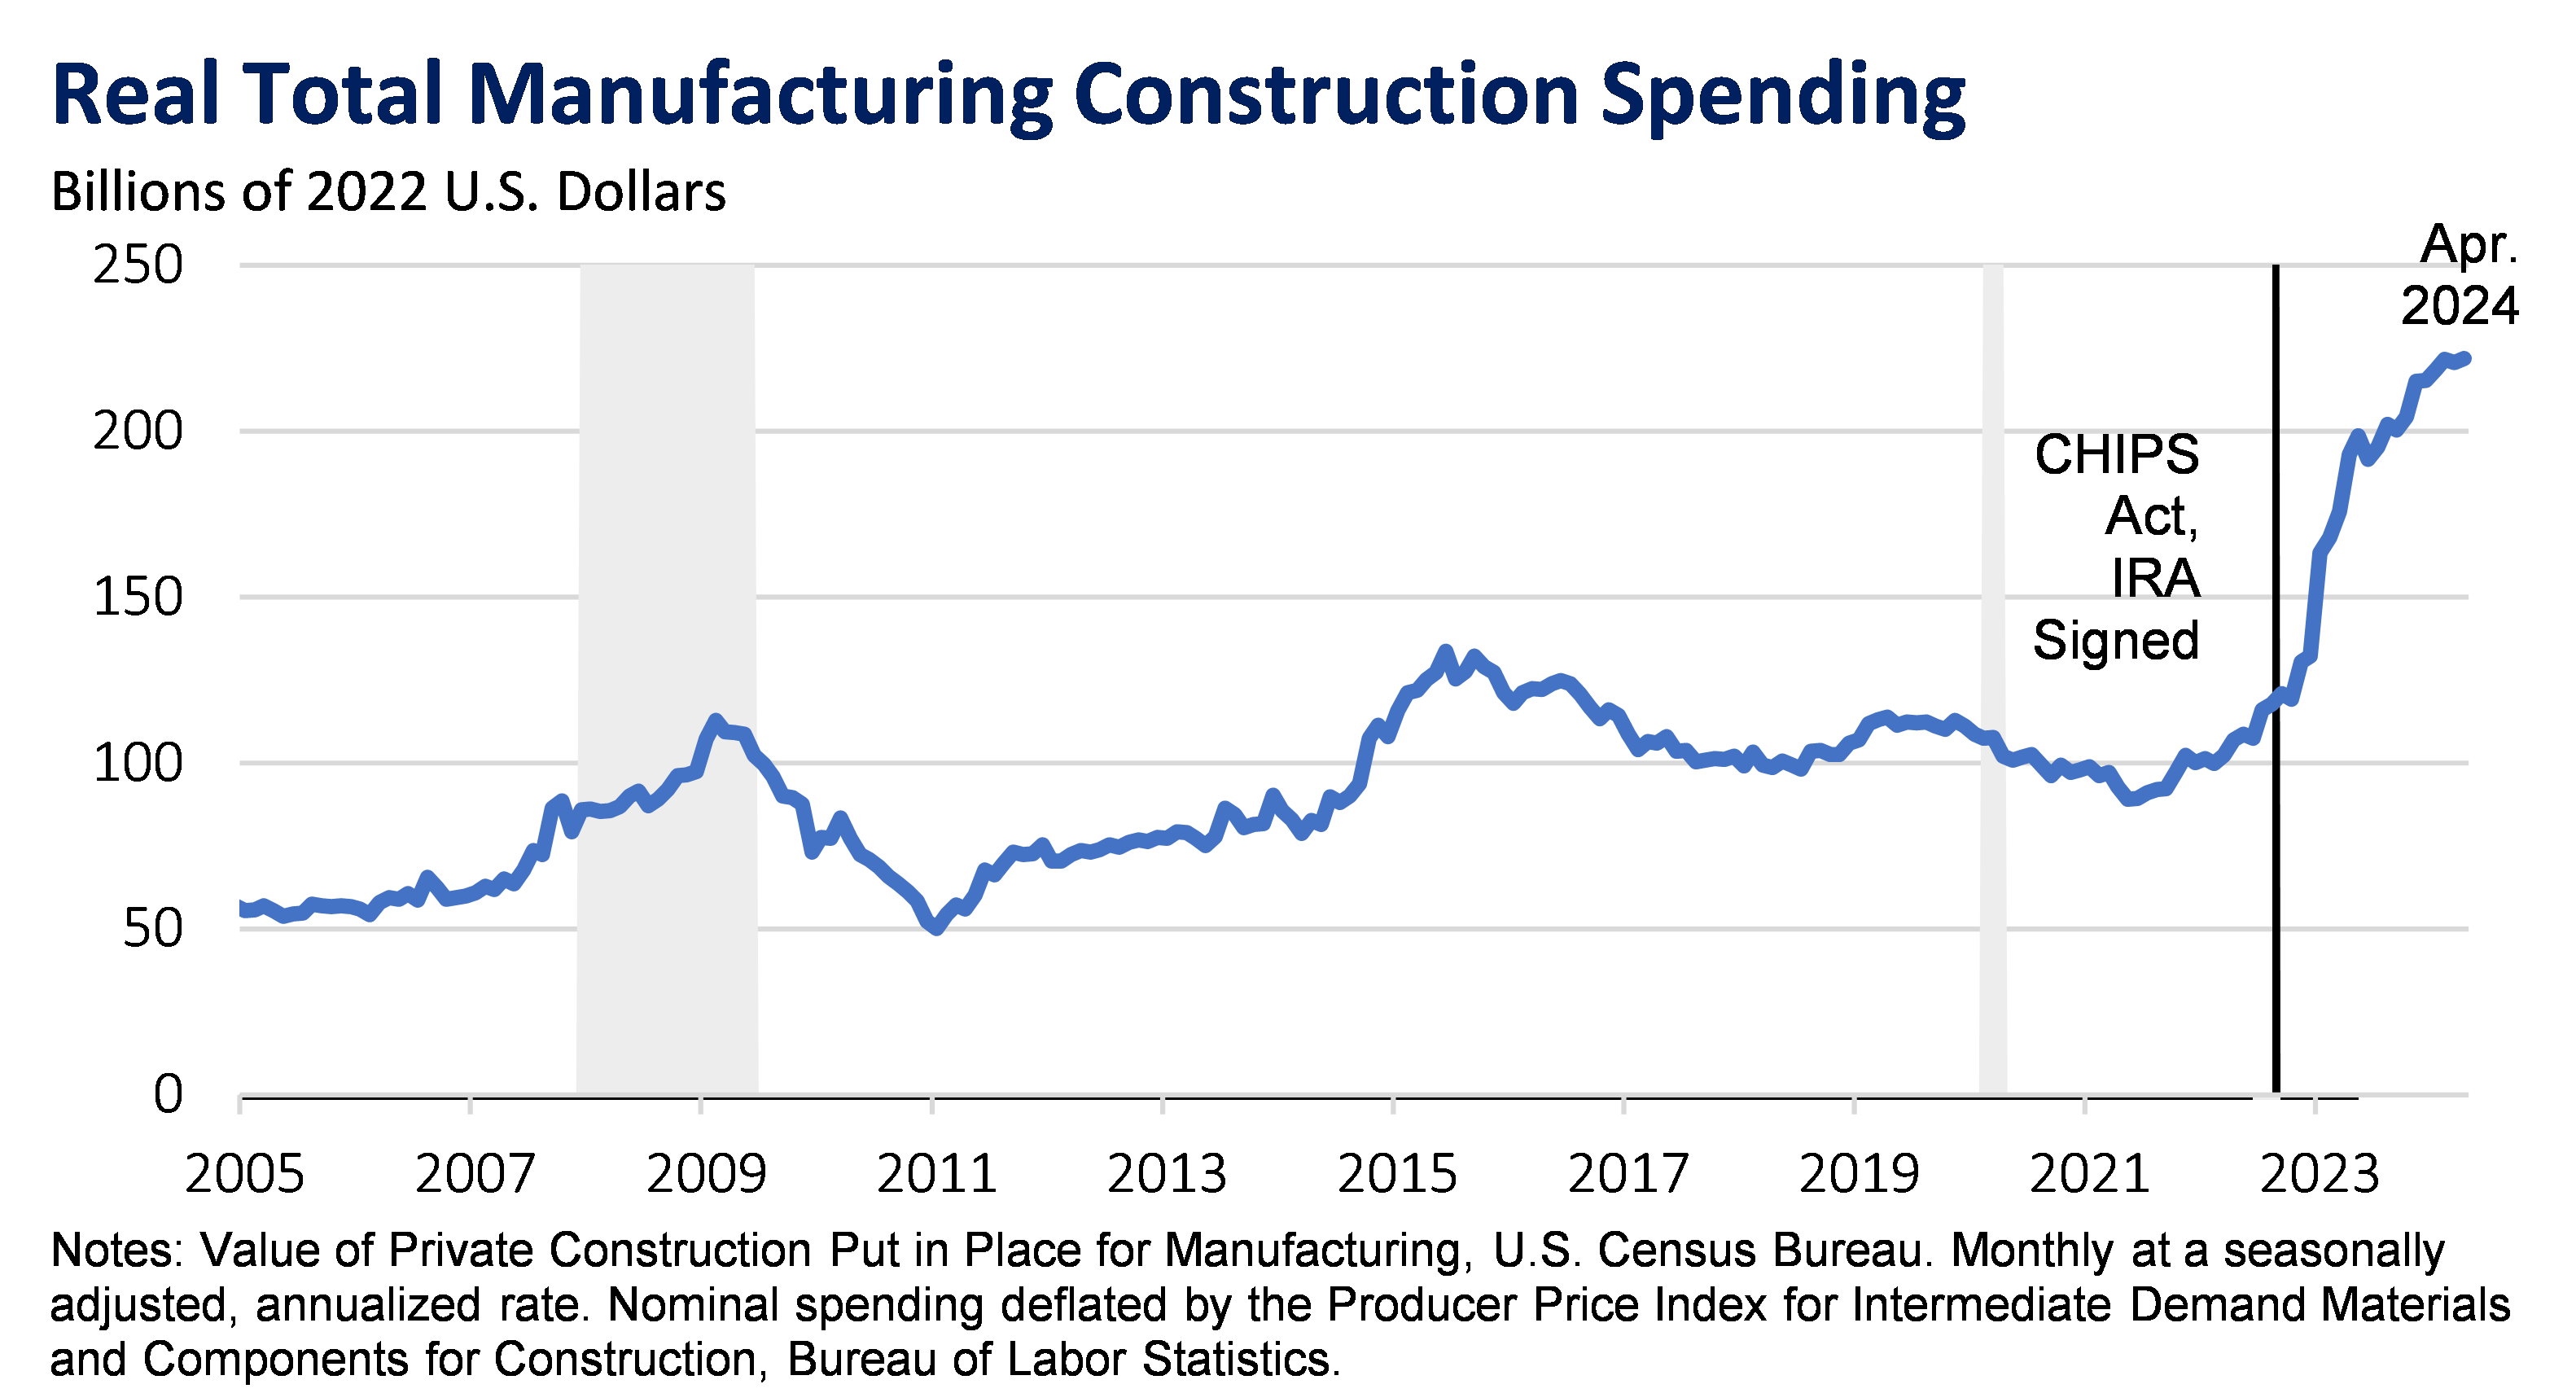
The surge in factory construction is well documented: spending has more than doubled in real terms since 2021 as shown in Figure 5, as we detailed here6 last summer, and it has further increased since then. Of course, one should not expect this surge to continue in perpetuity, so its contributions to business investment growth should dwindle. But it has reflected a new kind of private investment that helps explain the resilience of overall business investment.
Figure 5
Data from the Census Bureau allows us to further decompose the surge in manufacturing construction. Figure 6 compares the composition of real manufacturing construction spending on average from 2005-2022 to the average since the beginning of 2023. Factories in “computer, electrical, and electronic” manufacturing are the obvious source of the surge—a category that includes semiconductors and electric vehicle batteries. This is consistent with the CHIPS and Science Act and the Inflation Reduction Act achieving their aim of encouraging private investment in semiconductor manufacturing.
Figure 6

Outlook for Future Business Investment Growth
In a simple model of business investment, firms will invest capital where they expect to receive the highest risk-adjusted return relative to saving the capital or returning it to shareholders. All else being equal, higher interest rates make the alternative of saving more appealing, and might be expected to slow investment. But the stellar performance of business investment in recent years suggests firms have confidence their investments will earn high returns. Here, we share two pieces of evidence that firms are expecting higher returns to investment: returns to all private capital remain historically high (suggesting that firms can expect to earn significant profits from investing rather than saving), and applications for new businesses are surging (suggesting that founders expect historically high rewards from going into business). Both these points should give observers more confidence in continued strong U.S. business investment growth.
Returns to Private Capital Are Historically High, Encouraging Investment Today
First, estimates of the return to all private capital remain historically high; observing these high returns gives businesses confidence that their investments will pay off in the future. Perhaps best understood as the “aggregate return on all private investment,” the return to all private capital reflects the total returns generated by the full capital stock of the United States. Estimates vary, but Figure 7 uses the methodology developed in Furman (2015). This measure of the return to private capital has hovered around 7 percent since 2015, a figure that remains well above today’s elevated borrowing costs.
Figure 7
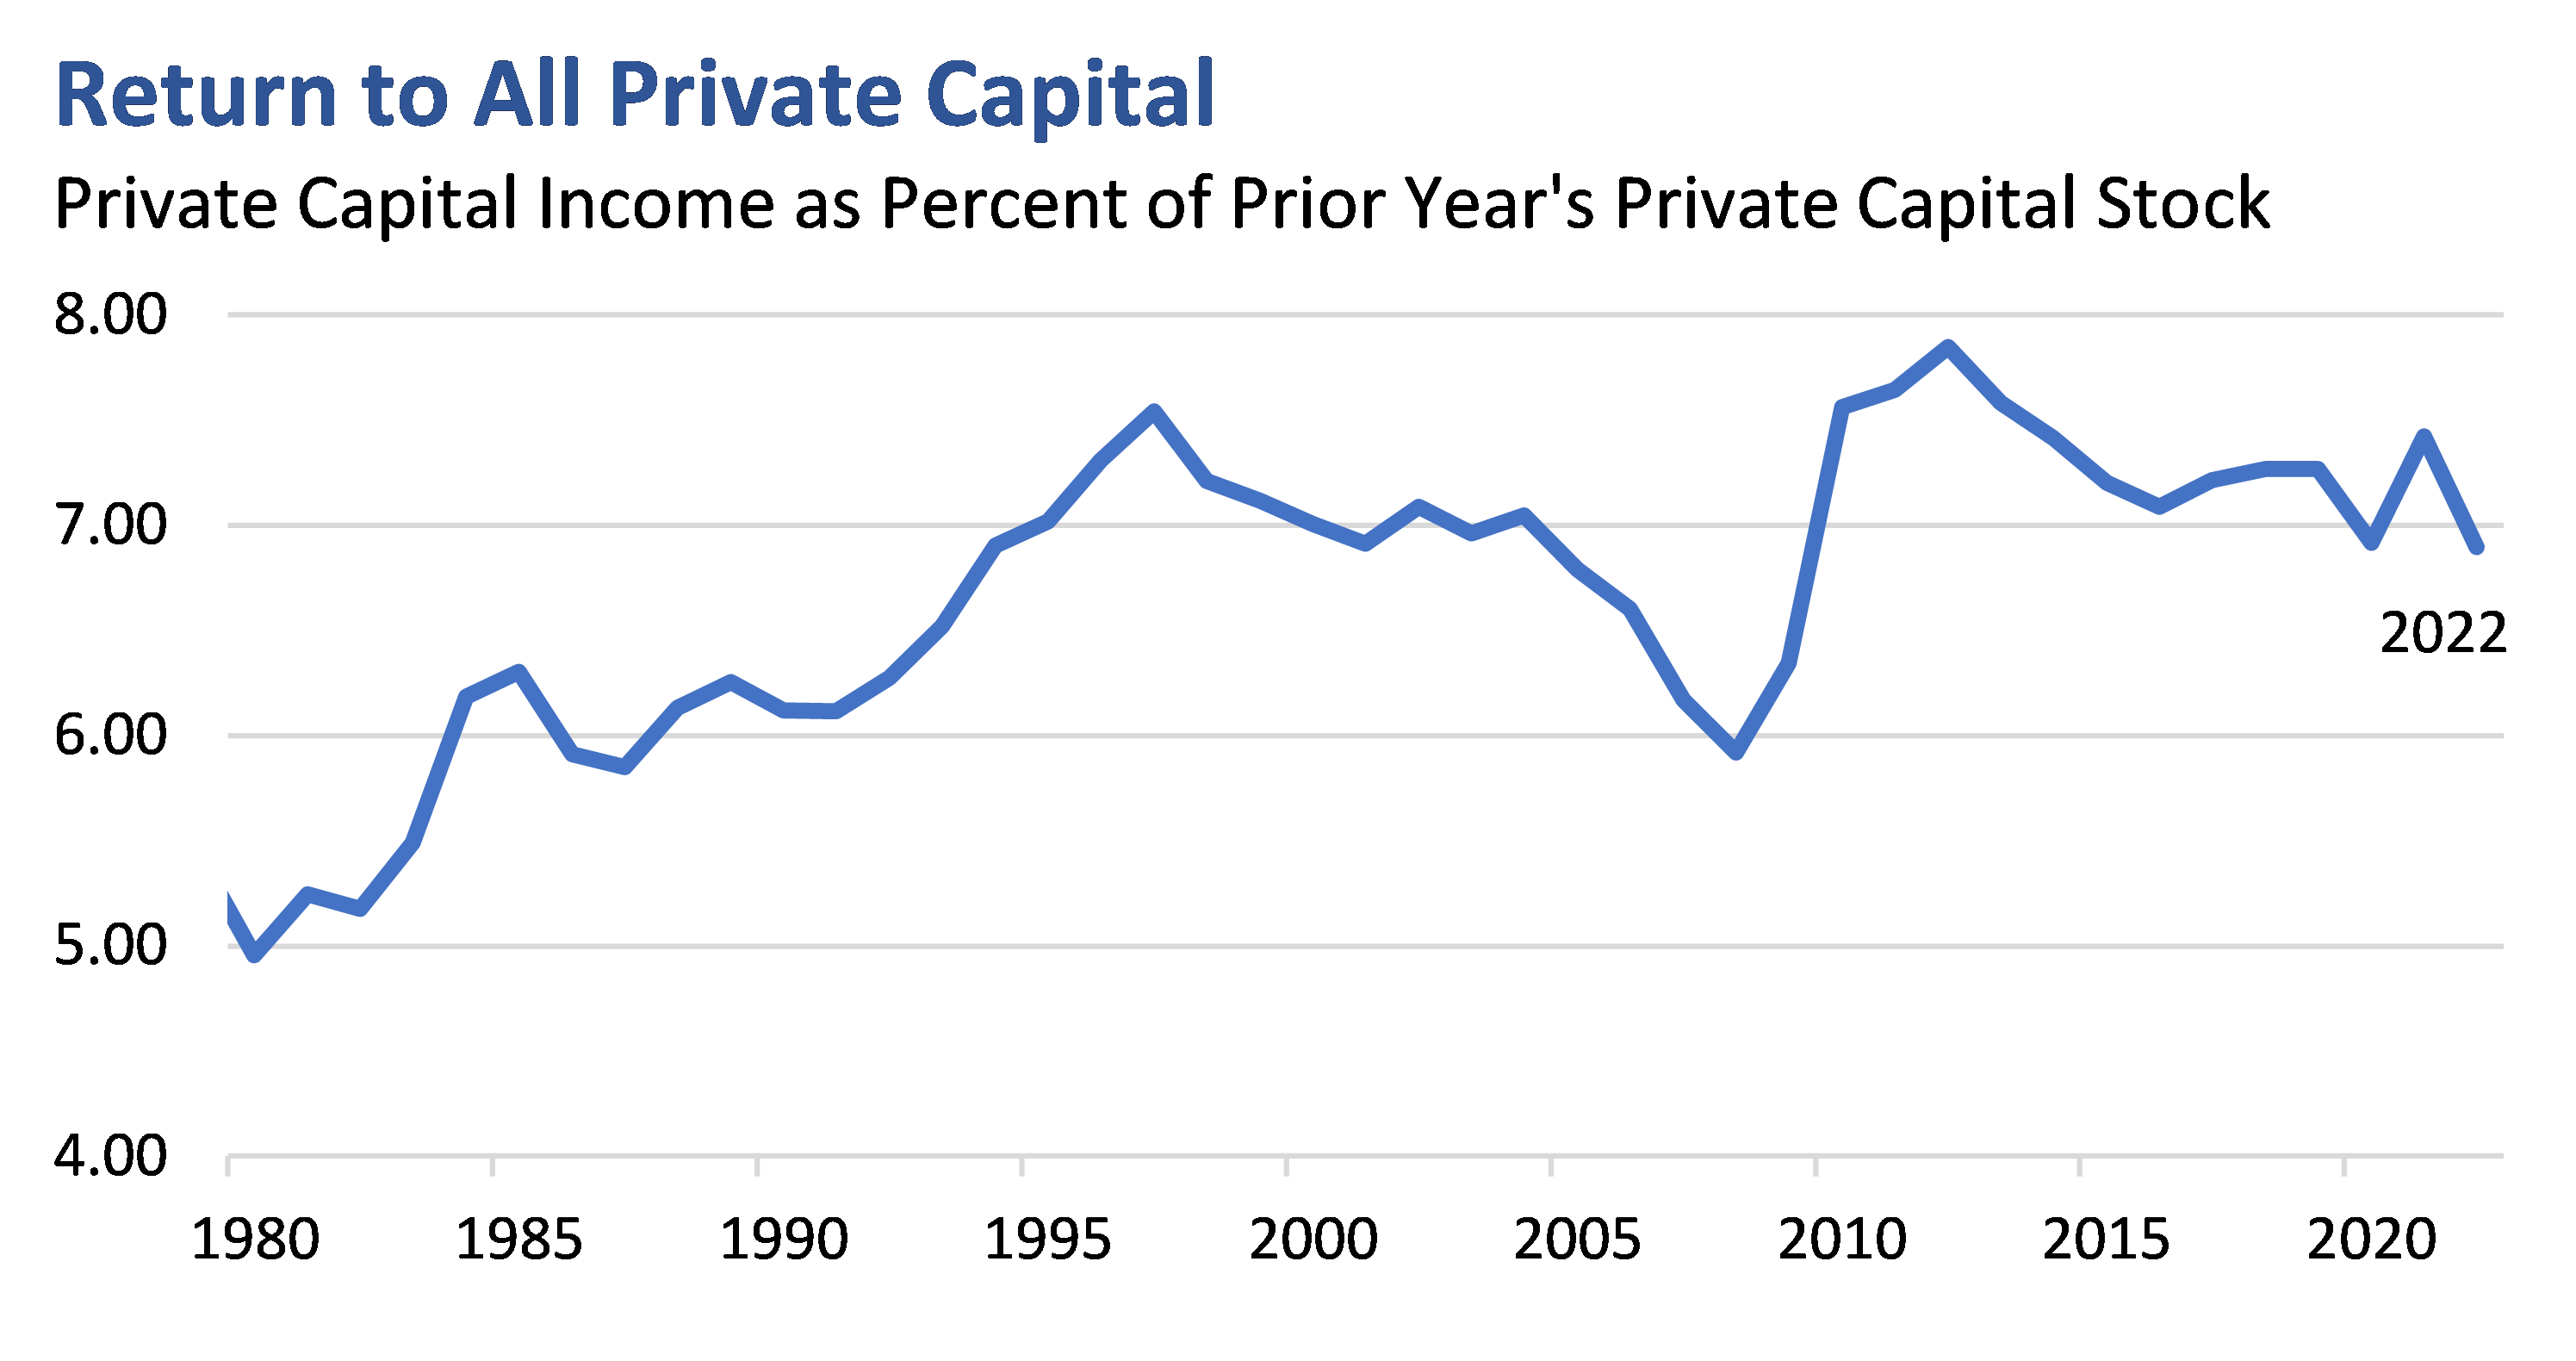
Notes: The return to all private capital is measured as in Furman (2015), as the private capital income as a percent of the prior year’s private capital stock. Private capital income is defined as the sum of 1) corporate profits ex. federal government tax receipts on corporate income, 2) net interest and miscellaneous payments, 3) rental income of all persons, 4) business current transfer payments, 5) current surpluses of government enterprises, 6) property and severance taxes, and 7) the capital share of proprietors’ income, where the capital share was assumed to match the capital share of aggregate income. The private capital stock is defined as the sum of 1) the net stock of produced private assets for all private enterprises, 2) the value of total private land inferred from the Financial Accounts of the United States, and 3) the value of U.S. capital deployed abroad less foreign capital deployed in the United States.
Sources: Bureau of Economic Analysis (Fixed Asset Accounts); Federal Reserve Board (Financial Accounts of the United States); U.S. Treasury calculations.
This calculation is only available through 2022, but strong corporate profit growth and high recent returns in public equity markets, even relative to higher interest rates, suggest that businesses are observing no slowdown in returns available in the market.
Another important piece evidence that firms expect higher returns to investment is that more Americans are starting firms. The new establishment birth rate, or the number of new firms as a share of existing firms, which had been largely stagnant but rising gradually since the Great Recession, surged after the pandemic, and peaked at an all-time high in 2022. It has since been normalizing, but remains above pre-pandemic rates. More start-ups suggests that more founders expect strong returns from starting businesses than otherwise.
Figure 8
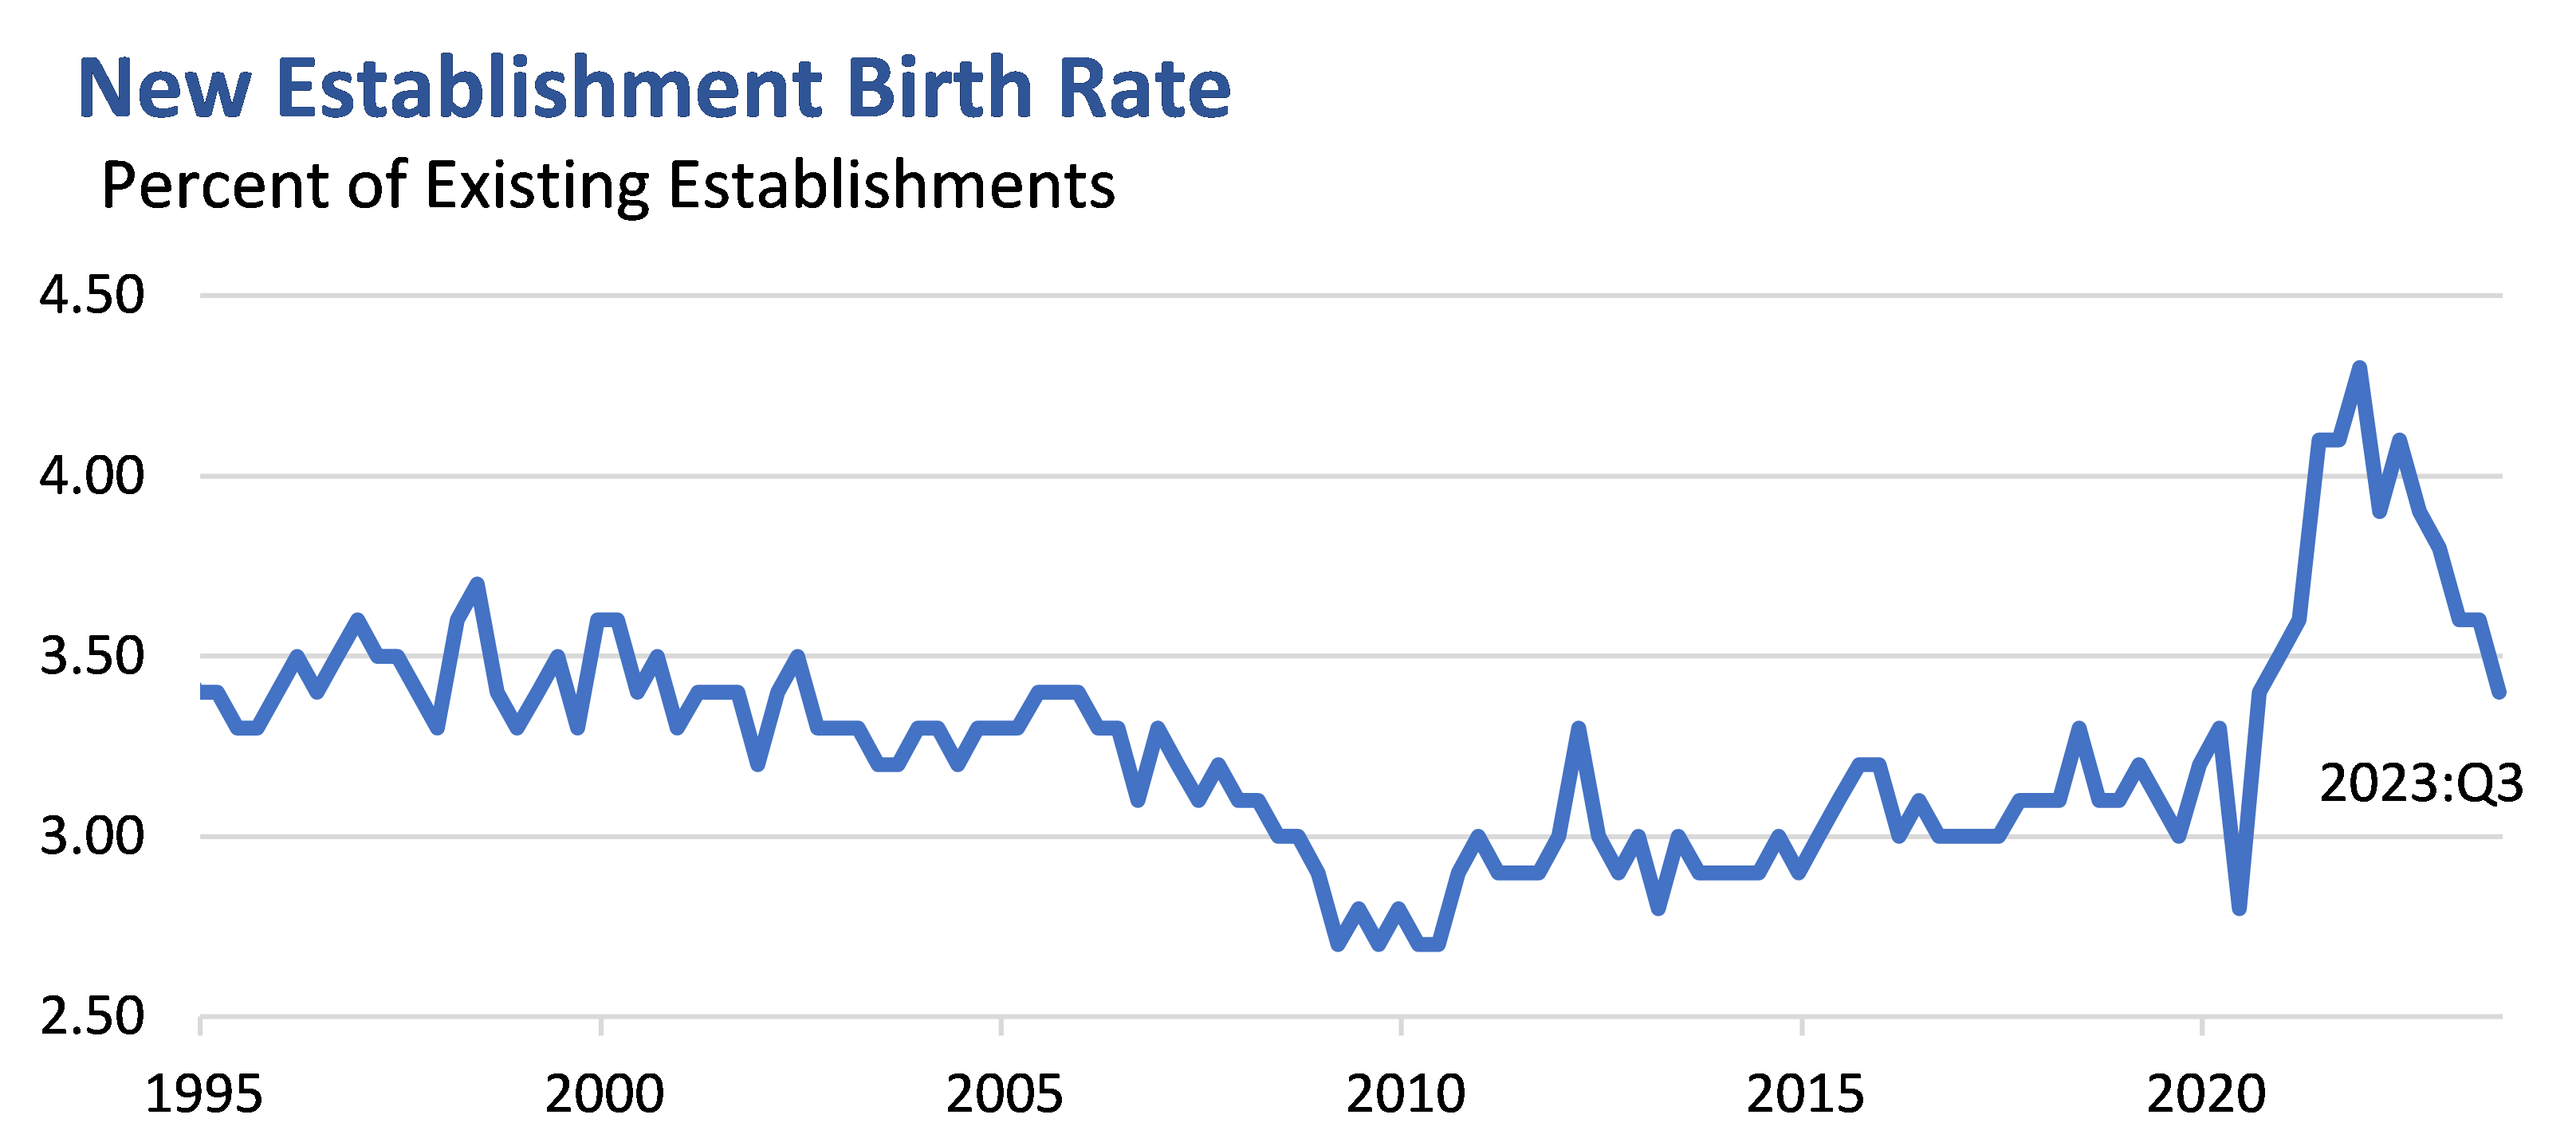
Note: The new establishment birth rate is calculated from the U.S. Census Bureau’s Business Employment Dynamics database. It is measured as the number of new establishments as a share of all establishments in the United States.
Source: U.S. Census Bureau.
For a more forward-looking read on the propensity to start businesses, though, we can observe the new business applications data from the Census Bureau’s Business Formation Statistics. There has been a structural break in the rate of new business applications received since the pandemic, with the monthly rate rising from just under 300,000 per month in 2018 and 2019 to between 400,000 and 500,000 per month in the past two years, as shown in Figure 9. The magnitude and persistence of the change in business application rates after the pandemic remains something of a puzzle. But it is an encouraging signal that the post-pandemic business climate in the United States is leading more to invest their time, efforts, and capital in the American economy.
Figure 9
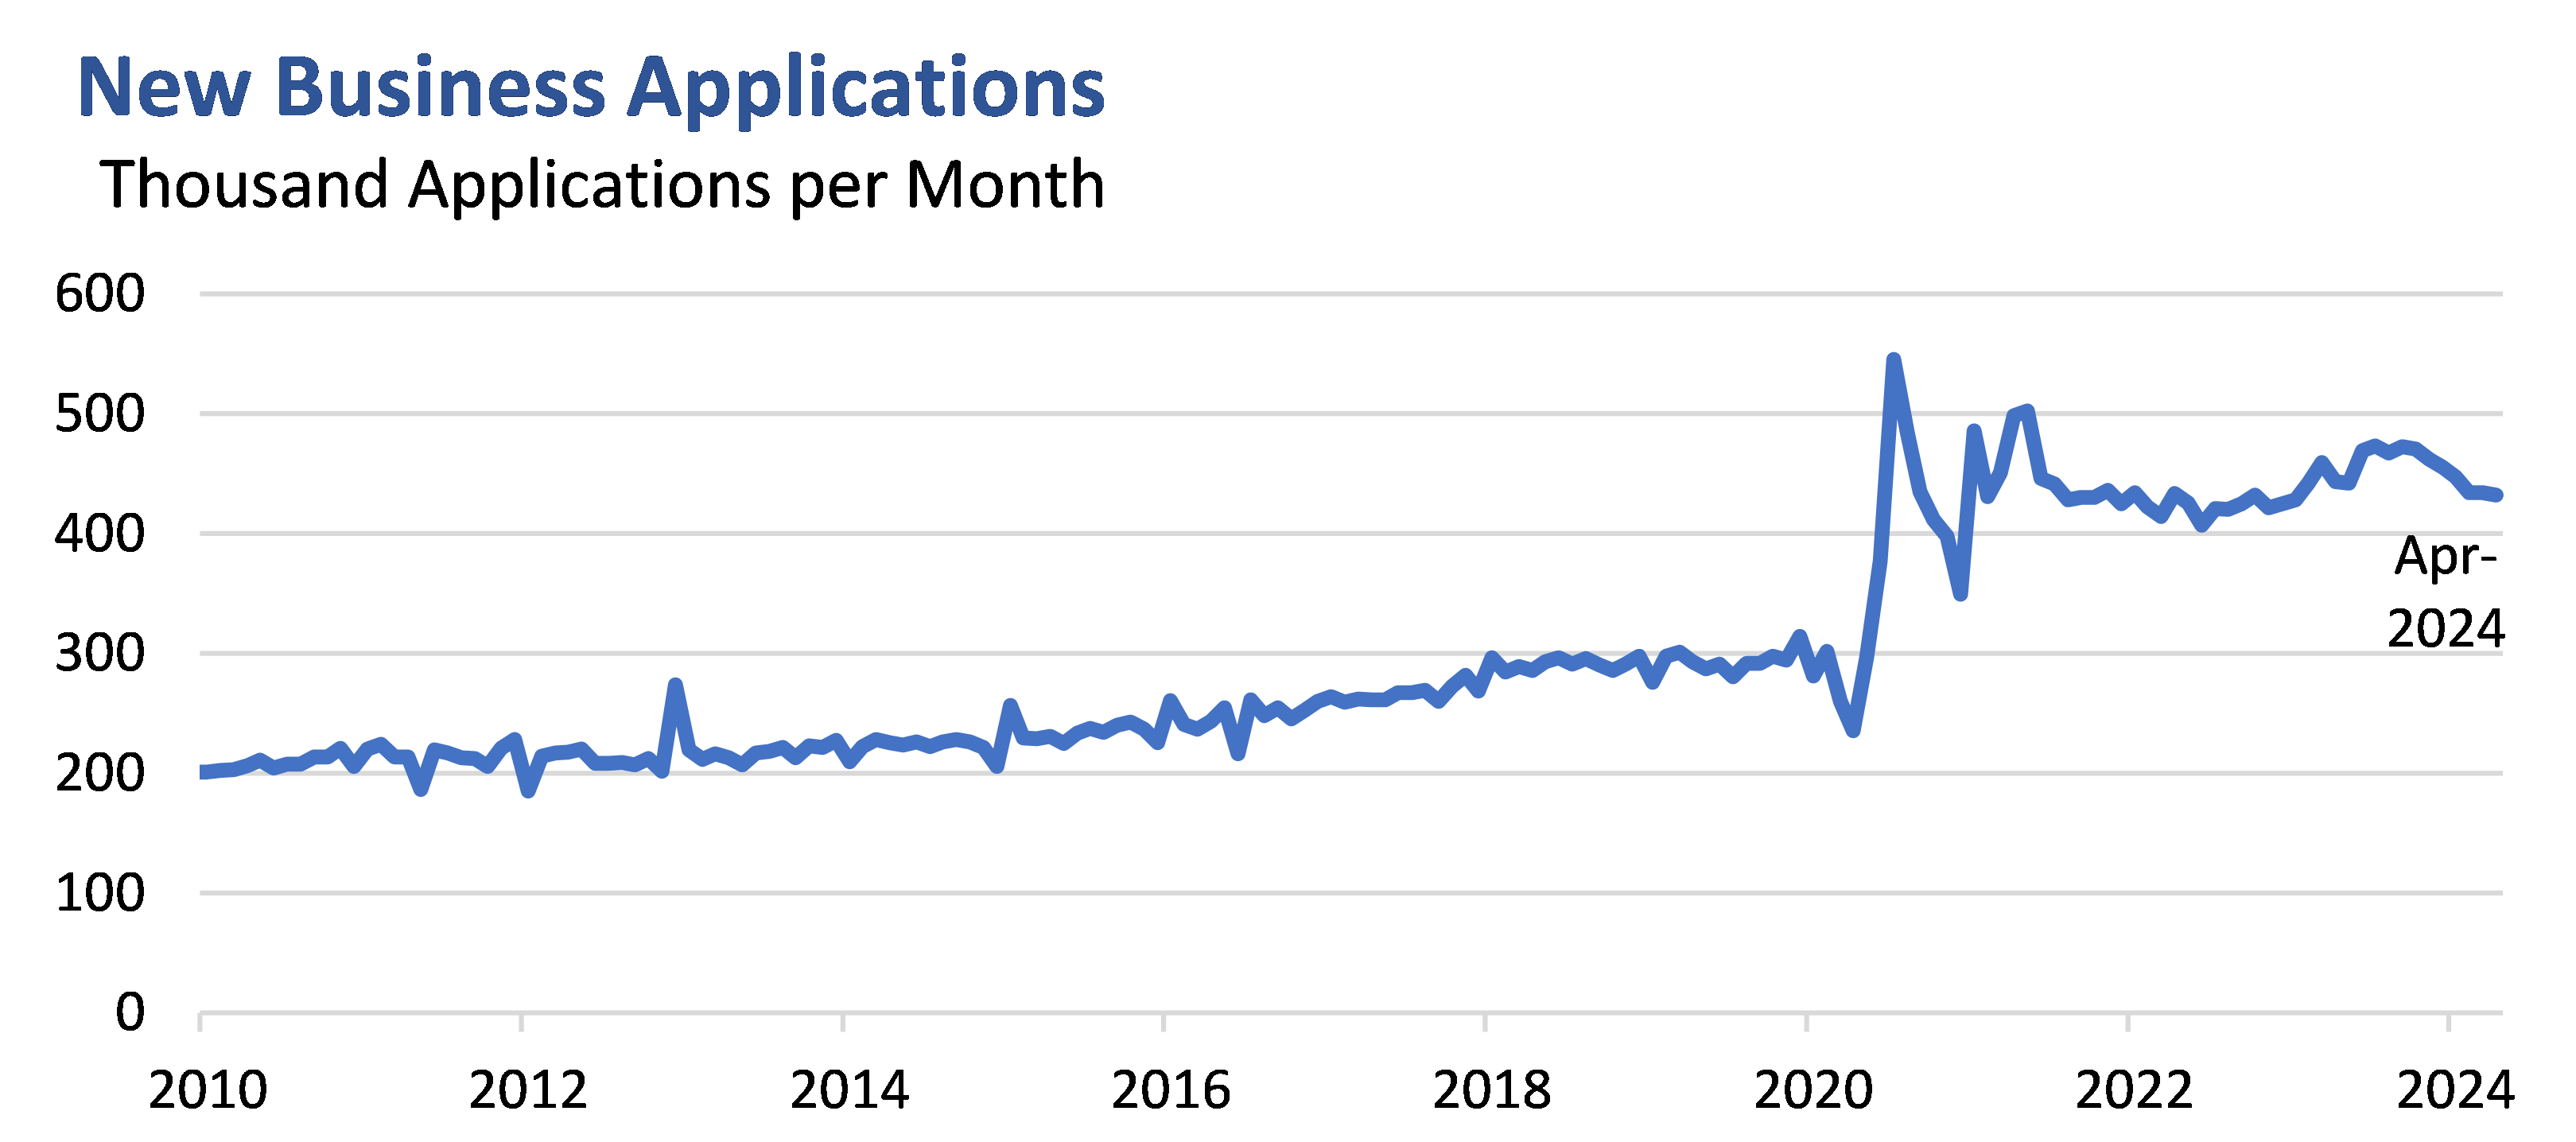
Source: U.S. Census Bureau, Business Formation Statistics.
Conclusion
Between macroeconomic data and impressive progress at the micro level, there are many reasons for optimism around the business investment outlook. The Administration’s growth agenda is focused not on boosting demand in the short term, but on improving long run productivity by encouraging American companies to invest in our capacity to produce. That is a central element of the strategy Secretary Yellen has called “modern supply-side economics,” reflecting a recognition that the next phase of economic growth will involve building a productive economy that can address our biggest challenges.
The resilience of investment since the pandemic reflects the impact of this focus already, as the Administration’s policies encourage a rebound in strategic sectors like manufacturing and clean technology. Many questions remain about the relationship between this modern industrial strategy and conventional investment growth, but so far the results are encouraging. These policies are helping create space and confidence for more Americans to invest their time, labor, and capital in strengthening our economy.
[1] For example, see Jason Furman, Business Investment in the United States: Facts, Explanations, Puzzle, and Policies (2015) and the International Monetary Fund’s 2015 World Economic Outlook Chapter 5, Private Investment: What’s the Holdup?
[2] Actual business fixed investment from 2020:Q1 to 2024:Q1 was $14,054 billion, when summed over periods. As a counterfactual, we measure what business fixed investment would have been if actual nominal GDP figures were realized over that period, but business fixed investment as a share of GDP followed the average pattern depicted in the dotted line in Figure 1; this is $13,627 billion, for a difference of $427 billion.
[3] Alvin Hansen, Full Recovery or Stagnation? (1938).
[4] Jorgenson, Dale and Calvin Siebert. 1968. "A Comparison of Alternative Theories of Corporate Investment Behavior." American Economic Review, Vol. 58(4). 681-712.
[5] International Monetary Fund World Economic Outlook 2015: Private Investment: What’s the Holdup? Appendix 4.5.1.
[6] Van Nostrand, Eric, Tara Sinclair, and Samarth Gupta. "Unpacking the Boom in U.S. Construction of Manufacturing Facilities." U.S. Department of the Treasury. June 27, 2023.