
This is the fifth installment in a series of blog posts on racial inequality produced by the Office of Economic Policy. The other posts can be found at these links: 1. Racial Inequality in the United States, 2. Racial Differences in Economic Security: The Racial Wealth Gap, 3. Racial Differences in Economic Security: Housing, 4. Racial Differences in Economic Security: Non-housing Assets
Introduction
Free public primary and secondary education in the United States was established to ensure that all Americans have access to educational opportunity and are equipped to fully participate in our democracy. However, laws banning enslaved people from being taught to read, exclusionary Jim Crow laws, and the ruling in Plessy v. Ferguson entrenched racial segregation of public schools in the South, and, while not mandated by law, a de facto system of segregation became commonplace in Northern states at the same time. These systems were used to deprive people of color of the educational resources required to prosper in society throughout the 19th and 20th centuries.
Nearly 70 years after the landmark ruling in Brown v. Board of Education that ended legal school segregation, substantial racial disparities in educational opportunity and attainment still exist. Recognizing these disparities and understanding their determinants is important because they have stark implications for labor market outcomes, including employment, wages and earnings, and occupations and job quality, all key factors in individuals’ economic wellbeing.
In addition, since education is the bedrock of labor productivity, policies that raise the quality and quantity of education for underserved groups have and would boost productivity for the country as a whole. One well-cited study finds that 40 percent of per capita GDP growth from the period of 1960 to 2010 can be accounted for by women and Black men entering into highly skilled occupations.[1] Although disparity in access to high quality education is only one of many barriers faced by workers of color, these findings demonstrate the potential magnitude of the gains that would come from better fostering the talent innate in our future workforce. Indeed, researchers from the Federal Reserve Bank of San Francisco estimate that removing racial gaps in educational attainment alone—separate from any effect on employment or hours—would have increased GDP in 2019 by $190 billion.[2]
In this blog post, we discuss racial differences in K-12 and postsecondary educational experiences, highlighting current disparities and changes in these disparities during the recent past. We then discuss their key determinants and show these determinants are factors outside students’ control, including the socioeconomic status of their parents, the schools they attend, the neighborhoods in which they live, discrimination in disciplinary actions, the race of the teacher to which they are assigned, and implicit bias in teacher expectations.
Racial Disparities in Elementary and Secondary Education
Childhood educational experiences have been shown to shape academic outcomes in adolescence and later in life, impacting indicators of well-being far into adulthood. Racial differences in childhood educational experiences thus have the potential to place children of different races on different trajectories at an early age, making it more difficult for some to achieve economic security in adulthood than others. In future blog posts in this series, we will discuss the disparities in labor market outcomes and how they are intertwined with the educational disparities outlined in today’s post.
Although school enrollment rates are similar across race and ethnicity for three- to five-year-old children,[3] research indicates that substantial gaps in reading and math achievement exist at the beginning of kindergarten as shown in Table 1. Black-white gaps in reading and math are about one-half and three-quarters of a standard deviation, respectively, and Hispanic-white gaps in both subjects are similarly large.[4] Gaps between students of any other race, a diverse category which includes Asian, Native Hawaiian/Other Pacific Islander, and American Indian/Alaska Native children in addition to children of multiple races, and white students are about 0.4 standard deviations for both reading and math.[5]
Table 1. Racial Achievement Gaps in Elementary and Middle School
| Reading | ||||||
|---|---|---|---|---|---|---|
| Fall K | Spring K | Spring 1 | Spring 3 | Spring 5 | Spring 8 | |
| Asian | 0.22 | 0.32 | 0.33 | 0.11 | 0.08 | 0.17 |
| Other | -0.41 | -0.28 | -0.30 | -0.37 | -0.32 | -0.33 |
| Hispanic | -0.48 | -0.26 | -0.26 | -0.33 | -0.34 | -0.36 |
| Black | -0.53 | -0.58 | -0.54 | -0.77 | -0.87 | -0.95 |
Math | ||||||
| Fall K | Spring K | Spring 1 | Spring 3 | Spring 5 | Spring 8 | |
| Asian | 0.07 | 0.05 | 0.01 | 0.08 | 0.29 | 0.38 |
| Other | -0.42 | -0.29 | -0.34 | -0.40 | -0.30 | -0.33 |
| Hispanic | -0.76 | -0.65 | -0.53 | -0.50 | -0.45 | -0.44 |
| Black | -0.73 | -0.80 | -0.77 | -0.90 | -0.99 | -1.00 |
Notes: Table shows estimated achievement gaps in standard deviations for each racial and ethnic group relative to white students. Standard deviation units are based on the standard deviation across all students for a given test-grade-year combination. The Asian category is comprised of Asian-origin students who are proficient in oral English at the beginning of kindergarten. Data are from the Early Childhood Longitudinal Study – Kindergarten Class of 1998-99 public-use K-9 longitudinal data set. See Reardon, Robinson-Cimpian, and Weathers (2015) for details.
Source: Table 3 of Reardon, Sean F., Joseph P. Robinson-Cimpian, and Ericka S. Weathers. 2015. “Patterns and Trends in Racial/Ethnic and Socioeconomic Academic Achievement Gaps.” In Handbook of Research in Education Finance and Policy, edited by Helen F. Ladd and Margaret E. Goertz, 499-518. New York: Routledge.
Although the Black-white and Hispanic-white gaps for reading and math are similar at the beginning of elementary school, the Black-white gaps widen as students progress through secondary school while the Hispanic-white gaps shrink. The Black-white gaps in reading and math expand from 0.53 and 0.73 standard deviations, respectively, in the fall of kindergarten to 0.95 and 1 standard deviations, respectively, in the spring of 8th grade. In contrast, the Hispanic-white reading and math gaps fall from 0.48 and 0.76 to 0.36 and 0.44, respectively, over the same period.[6]
Most of the widening of the Black-white gaps occurs in elementary school, with evidence of little change after eighth grade.[7] Similarly, most of the narrowing of the Hispanic-white gaps occurs early in elementary school, and research shows the gaps continue to narrow (less rapidly) as students progress through middle and high school.[8] These patterns, coupled with evidence that gains early in elementary school are concentrated among recent immigrants and students with low levels of English proficiency, have led some scholars to conclude that the improvements among Hispanic students are likely driven in part by the development of English language skills among these students.[9]
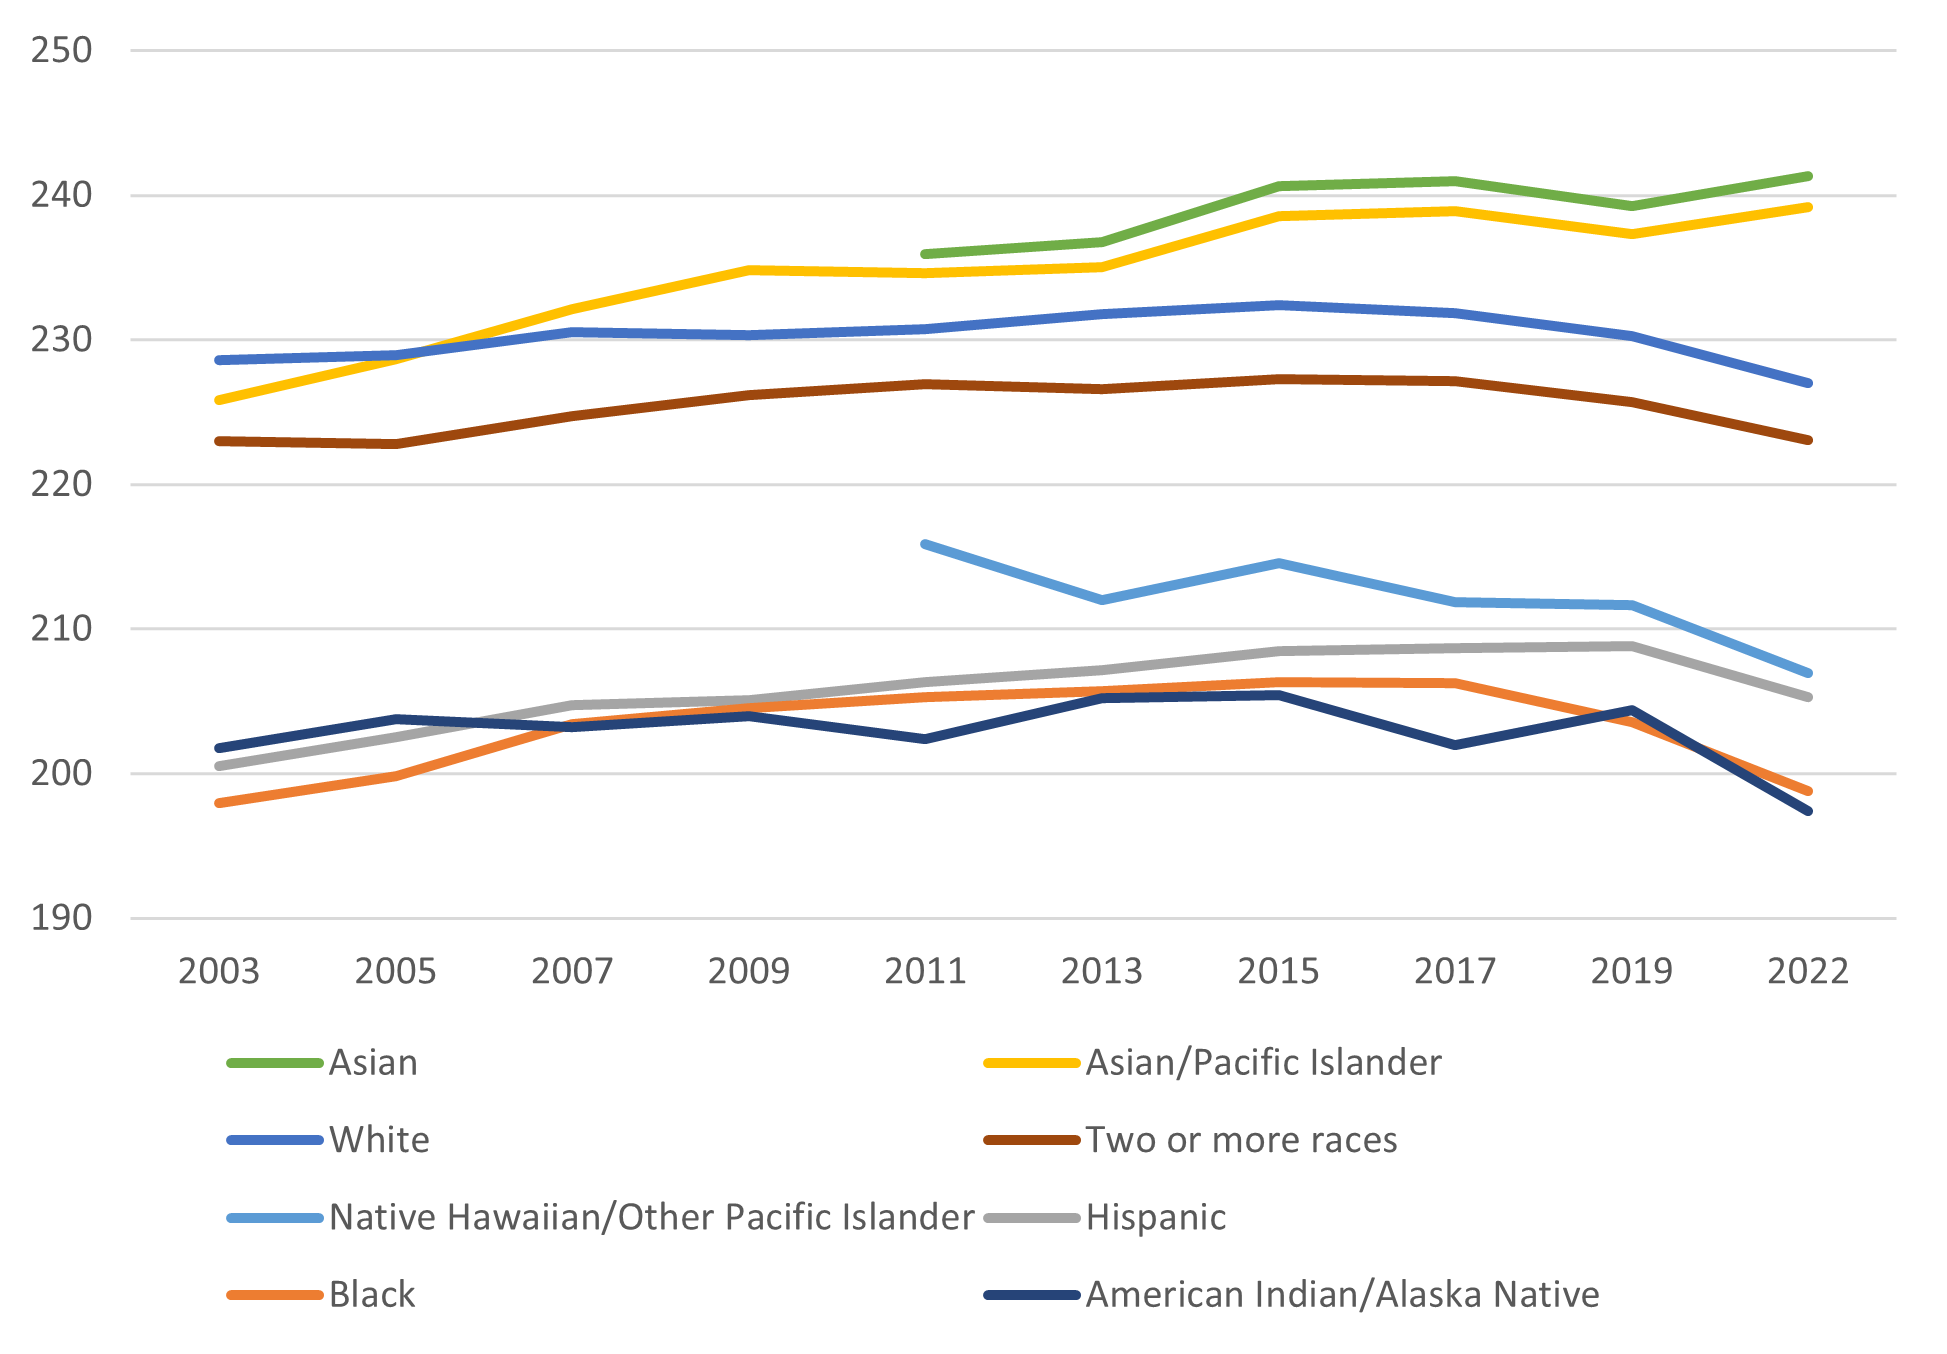
In addition to highlighting trends in achievement gaps as students progress through school, it is important to understand how achievement gaps have changed over time for students in a given grade. To that end, Figures 1 and 2 display differences in scores from the National Assessment of Educational Progress (NAEP) in reading and mathematics, respectively, for students of different races and ethnicities relative to white students. In 2003, the gaps between white and Black 4th grade reading and math scores were 31 and 27 points, respectively. By 2009, both gaps had closed to 26 and stayed relatively constant throughout the 2010s before widening to 28 (reading) and 29 (math) in 2022, likely due to differential impacts of pandemic-related learning disruptions. In contrast, the Hispanic-white gaps in reading and math have been steadily closing over the last 20 years, improving from 28 and 22, respectively, in 2000 to 22 and 21 in 2022.
Prior to 2011, the scores of Asian and Native Hawaiian/Other Pacific Islander students were reported together, and students in this combined group performed similarly to if not slightly better than white students in both reading and math. However, as evident from the trends for students in these two groups reported separately after 2011, this aggregation masks important heterogeneity, with Asian students consistently outperforming white students in both reading and math and Native Hawaiian/Other Pacific Islander students consistently lagging behind.
Figure 1. Racial Differences in 4th Grade Reading Achievement
Notes: Figure displays differences between the National Assessment of Educational Progress (NAEP) Reading composite scale score for 4th graders in each racial/ethnic group relative to the score for white 4th graders.
Source: Data from the U.S. Department of Education, National Center for Education Statistics, National Assessment of Educational Progress (NAEP) Reading Assessments, retrieved from the Main NAEP Data Explorer.
Figure 2. Racial Differences in 4th Grade Math Achievement

Notes: Figure displays differences between the National Assessment of Educational Progress (NAEP) Mathematics composite scale score for 4th graders in each racial/ethnic group relative to the score for white 4th graders.
Source: Data from the U.S. Department of Education, National Center for Education Statistics, National Assessment of Educational Progress (NAEP) Mathematics Assessments, retrieved from the Main NAEP Data Explorer.
High school completion rates are another important measure of academic achievement in secondary school since high school completion is required for many jobs and to pursue postsecondary education. Figure 3 shows differences in high school completion by race and ethnicity over the last three decades. Since 1992, the percent of adults 25-years-old and older who have graduated from high school has increased for all racial and ethnic groups, with the largest improvements occurring among Black and Hispanic individuals, the groups with the lowest completion rates in 1992. High school completion rates increased from 68 percent in 1992 to 91 percent in 2021 for Black individuals and from 53 percent to 74 percent over that same period for Hispanic individuals. While there is still a relatively large gap in the Hispanic high school completion rate relative to others, it is clear that progress has been and continues to be made on this dimension.
Figure 3. High School Completion Rates by Race and Ethnicity
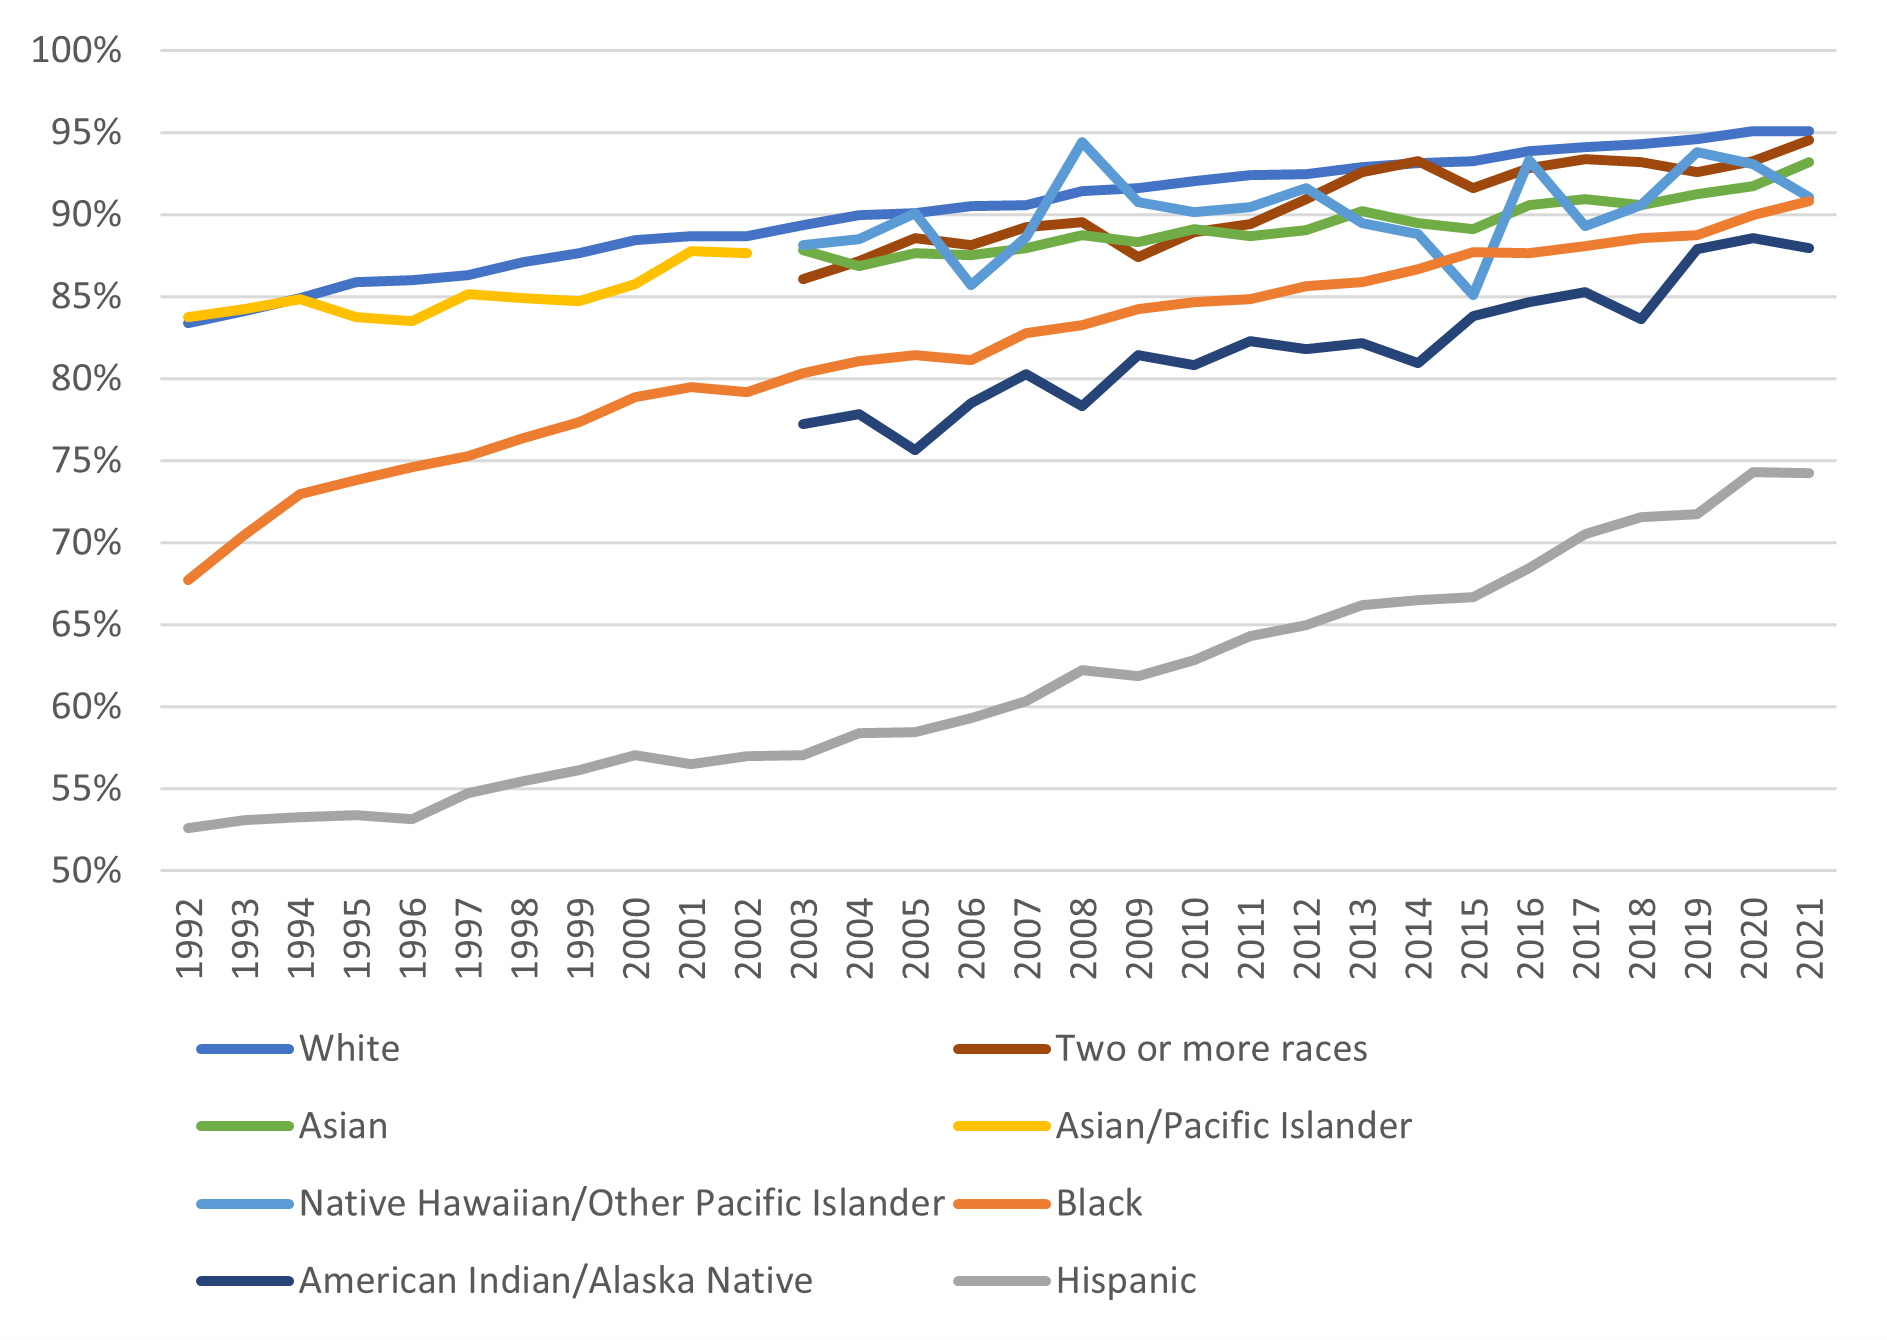
Notes: Figure displays the percent of people 25-years-old and older who have graduated from high school by race and ethnicity.
Source: Data from the U.S. Department of Commerce, U.S. Census Bureau, Current Population Survey, Annual Social and Economic Supplement, 1990 through 2021, prepared by the National Center for Education Statistics in November 2021 and retrieved from Digest of Education Statistics 2021, table 104.10.
Racial Disparities in Postsecondary Education
Racial disparities in education persist beyond high school and into postsecondary education and are evident in the differences in college enrollment rates visible in Figure 4, which shows the percent of 18- to 24-year-olds in each group enrolled in college or graduate school. College premiums remain high, such that these differences in enrollment and graduation rates will contribute to large disparities in lifetime earnings.[10]
Overall, the share of young adults enrolled in college has increased over the last three decades, with the largest gains occurring for Black and Hispanic individuals. In 1990, 25 percent of Black 18- to 24-year-olds were enrolled in college or graduate school, and by 2020, that number had risen to 36 percent. Over the same period, the share of Hispanic young adults enrolled in college or graduate school more than doubled from 16 percent to over 35 percent. White and Asian young adults, who had the highest rates of college enrollment in 1990, experienced smaller gains of roughly 6 to 7 percentage points, as did American Indian/Alaska Native young adults.[11] In contrast, the enrolled share of Native Hawaiian/Other Pacific Islander young adults and those belonging to two or more races declined between 2010 and 2020 from 36 percent to 34 percent and from 38 percent to 34 percent, respectively.[12]
Figure 4. College Enrollment by Race and Ethnicity

Notes: Figure displays the percent of 18- to 24-year-olds enrolled in college or graduate school by race and ethnicity. Data for Asian and Native Hawaiian/Other Pacific Islander individuals separately and for individuals of two or more races are not available until 2003.
Source: Data from the U.S. Department of Commerce, U.S. Census Bureau, Current Population Survey, October, 1990 through 2020 prepared by the National Center for Education Statistics in August 2021 and retrieved from Digest of Education Statistics 2021, table 302.60.
In addition to comparing overall college enrollment rates, it is important to consider the types of schools students enroll in. Students may enroll in institutions of different levels (two-year or four-year) and type (not-for-profit or for-profit). Given evidence of higher returns to an additional year of schooling at four-year institutions than at two-year institutions[13] and evidence that attending a for-profit institution may lead to worse post-college labor market and financial outcomes than not attending college at all,[14] differential enrollment patterns by race and ethnicity may lead to lasting differences in economic security post-college.
Figure 5 shows, for each racial and ethnic group, the distribution of undergraduates across institution levels and control of institution in Fall 2020. Asian and white undergraduates, along with undergraduates of two or more races are most likely to be enrolled at four-year institutions. In contrast, Hispanic, American Indian/Alaska Native, Black, and Native Hawaiian/Other Pacific Islander undergraduates are most likely to be enrolled at two-year institutions, although, notably, the share of Hispanic students enrolled at two-year institutions is nearly 10 percentage points larger than the share of Black students enrolled at these institutions. Black and Native Hawaiian/Other Pacific Islander students are much more likely than any other group to enrolled at for-profit institutions, both two- and four-year.
Figure 5. Racial Differences in Undergraduate Enrollment by Level and Type

Notes: Figure displays the percent of 18- to 24-year-olds enrolled in college or graduate school by race and ethnicity.
Source: Data from the U.S. Department of Education, National Center for Education Statistics, Integrated Postsecondary Education Data System (IPEDS, Spring 2021, Fall Enrollment component and retrieved from Digest of Education Statistics 2021, table 306.50.
These differences in enrollment patterns contribute to the racial differences in bachelor’s degree attainment that are evident in Figure 6. Since 1990, the percent of people 25 years old and older with a bachelor’s degree has increased for all racial and ethnic groups, but Black, Hispanic, Native Hawaiian/Other Pacific Islander, and American Indian/Alaska Native individuals still lag behind Asian and white individuals and those of two or more races.
Figure 6. Racial Differences in Bachelor’s Degree Attainment

Notes: Figure displays the percent of people 25 years old and older who have earned a bachelor’s degree by race and ethnicity.
Source: Data from the U.S. Department of Commerce, U.S. Census Bureau, Current Population Survey, Annual Social and Economic Supplement, 1990 through 2021, prepared by the National Center for Education Statistics in November 2021 and retrieved from Digest of Education Statistics 2021, table 104.10.
Determinants of Racial Disparities in Educational Experiences and Attainment
The Role of Socioeconomic Status
In this section, we will discuss the determinants of the racial disparities in education outlined above. Recall that sizeable achievement gaps exist at the beginning of kindergarten despite relatively similar pre-school enrollment rates. Therefore, these early disparities in achievement must be driven by something other than differences in access to formal schooling prior to elementary school. Research suggests that nearly all of the Black-white reading gap and over 80 percent of the Black-white math gap at the beginning kindergarten can be explained by differences in socioeconomic status and observed family background characteristics.[15] Similarly, there is evidence that socioeconomic factors and family background account for 85 percent of the Hispanic-white gap in reading achievement and 75 percent of the Hispanic-white math gap in kindergarten.[16] Socioeconomic status is measured using total family income and parental education and occupations, and family background characteristics include the age of the child’s mother at first birth, indicators for receiving aid from government social safety net programs, and the number of children’s books in the home.
The role that socioeconomic status plays in kindergarten achievement suggests that race-neutral policies designed to provide resources to underserved families may aid in closing racial achievement gaps early in elementary school. Head Start is one such policy, created in 1965 to improve school readiness of low-income three- and four-year-olds. While there is evidence that Head Start is effective at improving school readiness, there is also evidence that its effects on test scores fade out by the end of kindergarten.[17] These findings highlight both the benefits of supporting under-resourced families with young children and the limitations of temporary assistance.[18]
While most of the achievement gaps at the beginning of kindergarten are attributable to differences in socioeconomic status, evidence on the extent to which differences in socioeconomic factors can explain Black-white achievement gaps later in elementary school is somewhat mixed. Older studies find that as students progress through school, socioeconomic factors explain a smaller and smaller share of the Black-white gap, with these factors accounting for just 35 percent (or less) of the Black-white achievement gaps from third grade onward.[19] In contrast, more recent work that uses permanent (long-run) income as opposed to current income as a measure of socioeconomic status finds that these factors explain 40 to 75 percent of the gaps at the end of elementary school.[20] Similarly, recent research that takes into account the fact that test scores are imperfect measures of true skills finds that most, if not all, of the gaps throughout elementary and middle school can be explained by socioeconomic and family background factors.[21]
Research on the importance of socioeconomic factors in explaining Hispanic-white achievement gaps in elementary school is less mixed. Most research finds that these factors can explain an increasing share of Hispanic-white achievement gaps as students move through elementary school, so much so that estimates of the gap that are adjusted for differences in socioeconomic status disappear completely by fifth grade.[22]
The Role of Schools
While research suggests observable family background characteristics contribute substantially to racial achievement gaps in elementary and secondary school, there is an active debate about the extent to which schools reduce or exacerbate those disparities.
First, there is evidence that racial segregation in school districts is strongly associated with the magnitude of racial achievement gaps.[23] This is particularly concerning because although it has been nearly 70 years since the end of legal segregation, many of America’s public schools remain segregated by race and ethnicity today: 31 and 23 percent of Hispanic and Black students, respectively, attended a predominately same-race-or-ethnicity school, where 75 percent or more of the students are of their own race or ethnicity, in the 2020-2021 school year.[24] Additional research suggests that school segregation itself may have no effect on achievement gaps independent of the effects of neighborhood segregation,[25] so understanding the mechanisms through which school and neighborhood segregation impact racial achievement gaps (e.g., school and teacher quality, school funding, peer effects, crime, etc.) together and in isolation and their relative importance is a critical area for future research.
Second, differences in discipline rates by race and ethnicity may contribute to differences in achievement and educational attainment across groups. There is evidence both that being formally disciplined in school negatively impacts educational attainment,[26] and that Black public school students are disproportionately disciplined (via suspensions and expulsions) relative to public school students of other racial and ethnic groups for the same violations. These disparities persist no matter the type or poverty level of the public school attended.[27]
Finally, schools may impact racial differences in achievement and completion through the (non-disciplinary) interactions teachers have with students. For example, there is evidence that same-race elementary school teachers increase the likelihood of high school graduation and college enrollment among Black students, with role model effects as a potential mechanism,[28] and that teacher expectations – even overly optimistic ones – impact the likelihood of college graduation.[29]
Existing research on the determinants of racial college enrollment and completion gaps indicates that nearly all these gaps are attributable to differences in pre-college characteristics, including family socioeconomic status, other family background variables, and pre-college test scores, the latter of which, as discussed earlier in this blog post, are also largely determined by family characteristics. For example, there is evidence that once pre-college characteristics are taken into account, Black and Hispanic students are more likely to attend and complete colleges of all quality levels than white students.[30] These findings suggest that to improve racial gaps in college attendance and completion, policymakers should focus on improving educational opportunity much earlier in life and economic opportunity for families more broadly.
Conclusion
Racial disparities in educational experiences and attainment begin early in life and persist as individuals progress through school. Recognizing these disparities and understanding their determinants is important because they have stark implications for labor market outcomes, including employment, wages and earnings, and occupations and job quality, all of which are key determinants of economic wellbeing.
In particular, it is important to recognize that the key determinants of many of these disparities are factors outside students’ control, including the socioeconomic status of their parents, the schools they attend, the neighborhoods in which they live, discrimination in disciplinary actions, the race of the teacher to which they are assigned, and implicit bias in teacher expectations. Reducing these economic and educational disparities is an important policy goal, not only because of the benefits for individual students, but also because of the benefits to our national economy.
Overall, the findings in this blog post highlight both the limited progress that has been made over the last three decades in closing racial gaps in educational attainment, as well as the substantial work that remains to ensure equal access to high quality educational opportunities for all Americans.
[1] Hsieh, Chang-Tai, Erik Hurst, Charles I. Jones, and Peter J. Klenow. 2019. “The Allocation of Talent and U.S. Growth.” Econometrica, 87 (5): 1439-1474.
[2] See Table 3 of Buckman, Shelby R., Laura Y. Choi, Mary C. Daly, Lily M. Seitelman. 2021. “The Economic Gains From Equity.” Federal Reserve Bank of San Francisco Working Paper Series, Working Paper 2021-11. Retrieved from https://www.frbsf.org/economic-research/publications/working-papers/2021/11/.
[3] School enrollment rates for three- to four-year-olds were relatively similar across race and ethnicity in the decade leading up to the COVID-19 pandemic, ranging from 57 percent for Asian children to 46 percent for Hispanic children. Enrollment rates vary even less across race and ethnicity for five-year-olds, who are more likely to be enrolled in elementary school than younger children, ranging from 90 to 92 percent. In 2020, enrollment rates for all racial, ethnic, and age groups dropped due to the pandemic, with Hispanic, Asian, and American Indian/Alaska Native three- and four-year-olds experiencing the largest declines. Enrollment rates for white and Asian three-and four-year-olds rebounded in 2021 to or beyond their 2019 levels, but rates for Black and Hispanic young children and young children of two or more races have yet to fully recover. It is also important to note that young children with no formal schooling prior to elementary school may have received educational instruction from a stay-at-home parent or other caretaker, so differences in school enrollment rates prior to elementary school may not fully capture differences in educational experiences for young children. Source: U.S. Department of Commerce, U.S. Census Bureau, Current Population Survey, October, 2010 through 2021 prepared by the National Center for Education Statistics in October 2022 and retrieved from Digest of Education Statistics 2022, table 202.20.
[4] Standard deviation units are based on the standard deviation across all students for a given test-grade-year combination. Source: Reardon, Sean F., Joseph P. Robinson-Cimpian, and Ericka S. Weathers. 2015. “Patterns and Trends in Racial/Ethnic and Socioeconomic Academic Achievement Gaps.” In Handbook of Research in Education Finance and Policy, edited by Helen F. Ladd and Margaret E. Goertz, 499-518. New York: Routledge.
[5] See footnote 2.
[6] See footnote 2.
[7] See the following studies:
- Clotfelter, Charles T., Helen F. Ladd, and Jacob L. Vigdor. 2009. “The Academic achievement Gap in Grades 3 to 8.” The Review of Economics and Statistics 91 (2) 398-419.
- Neal, Derek. 2006. “Why Has Black-White Skill Convergence Stopped?” In Handbook of the Economics of Education, edited by Eric A. Hanushek and Finis Welch, 511-576. New York: Elsevier.
It is important to note that differential dropout patterns in high school may bias estimates of achievement gaps beyond eighth grade.
[8] Clotfelter, Charles T., Helen F. Ladd, and Jacob L. Vigdor. 2009. “The Academic achievement Gap in Grades 3 to 8.” The Review of Economics and Statistics 91 (2) 398-419.
[9] See the following studies:
- Reardon, Sean F., and Claudia Galindo. 2009. “The Hispanic-White achievement Gap in Math and Reading in the Elementary Grades.” American Educational Research Journal 46 (3): 853-96.
- Reardon, Sean F., Joseph P. Robinson-Cimpian, and Ericka S. Weathers. 2015. “Patterns and Trends in Racial/Ethnic and Socioeconomic Academic Achievement Gaps.” In Handbook of Research in Education Finance and Policy, edited by Helen F. Ladd and Margaret E. Goertz, 499-518. New York: Routledge.
[10] Hendricks, Lutz and Oksana Leukhina. 2018. “The Return to College: Selection and Dropout Risk.” International Economic Review 59 (3): 1077-1102.
[11] The sample size of the American Indian/Alaska Native group is small, such that enrollment rate estimates have standard errors above 5 in each year. The large measurement error may contribute to the anomalous reading in 2010.
[12] Due to small sample sizes, the standard errors for the enrollment rates of both of these groups are quite high—greater than 8 for Native Hawaiian/Other Pacific Islander, and greater than 3 for two or more races.
[13] Kane, Thomas J., and Cecilia Elena Rouse. 1995. “Labor Market Returns to Two-Year and Four-Year Schools. American Economic Review 85 (3): 600–614.
[14] See the following studies:
- Armona, Luis, Rajashri Chakrabarti, and Michael F. Lovenheim. 2018. “How Does For-Profit College Attendance Affect Student Loans, Defaults and Labor Market Outcomes?” NBER Working Paper 25041.
- Cellini, Stephanie Riegg, and Latika Chaudhary. 2014. “The Labor Market Returns to For-Profit College Education.” Economics of Education Review 43: 125-140.
- Cellini, Stephanie Riegg, and Nicholas Turner. 2019. “Gainfully Employed? Assessing the Employment and Earnings of For-Profit College Students Using Administrative Data.” The Journal of Human Resources 52(4): 342-370.
- Cottom, Tressie McMillan. 2017. Lower Ed: The Troubling Rise of For-Profit College in the New Economy. New York: The New Press.
- Deming, David J., Claudia Goldin, and Lawrence F. Katz. 2012. “The For-Profit Postsecondary School Sector: Nimble Critters or Agile Predators?” Journal of Economic Perspectives 26 (1): 139-64.
[15] See the following studies:
- Fryer, Ronald G., and Steven D. Levitt. 2004. “Understanding the Black-White Test Score Gap in the First Two Years of School.” Review of Economics and Statistics 86 (2): 447-64.
- Fryer, Ronald G., and Steven D. Levitt. 2006. “The Black-White Test Score Gap through Third Grade.” American Law and Economics Review 8 (2): 249-281.
- Murnane Richard J., John B. Willet, Kristen L. Bub, and Kathleen McCartney. 2006. “Understanding Trends in the Black-White achievement Gaps during the First Years of School.” Brookings-Wharton Papers on Urban Affairs 97-135.
[16] See footnote 4.
[17] See the following studies:
- Kline, Patrick, and Christopher R. Walters. 2016. “Evaluating Public Programs with Close Substitutes: The Case of Head Start.” The Quarterly Journal of Economics 131 (4): 1795-1848.
- U.S. Department of Health and Human Services, Administration for Children and Families. 2010. Head Start Impact Study Final Report. Washington, DC. Retrieved from https://www.acf.hhs.gov/sites/default/files/documents/opre/executive_summary_final_508.pdf.
It is also important to note that recent work provides evidence that Head Start positively impacts later-in-life outcomes including years of education and wage income with stronger effects for Black and Hispanic individuals. See:
- De Haan, Monique and Edwin Leuven. 2020. “Head Start and the Distribution of Long-Term Education and Labor Market Outcomes.” Journal of Labor Economics 38 (3) 727-765.
[18] Johnson and Jackson (2019) find that the benefits of Head Start were larger when followed by access to better-funded schools, highlighting the potential benefits of early educational investments that are sustained.
- Johnson, Rucker C., and C. Kirabo Jackson. 2019. “Reducing Inequality through Dynamic Complementarity: Evidence from Head Start and Public School Spending.” American Economic Journal: Economic Policy 11 (4): 1-40.
[19] See the following studies:
- Clotfelter, Charles T., Helen F. Ladd, and Jacob L. Vigdor. 2009. “The Academic achievement Gap in Grades 3 to 8.” The Review of Economics and Statistics 91 (2) 398-419.
- Fryer, Ronald G., and Steven D. Levitt. 2006. “The Black-White Test Score Gap through Third Grade.” American Law and Economics Review 8 (2): 249-281.
- Murnane Richard J., John B. Willet, Kristen L. Bub, and Kathleen McCartney. 2006. “Understanding Trends in the Black-White achievement Gaps during the First Years of School.” Brookings-Wharton Papers on Urban Affairs 97-135.
[20] Rothstein, Jesse, and Nathan Wozny. 2013. “Permanent Income and the Black-White Test Score Gap.” The Journal of Human Resources 48 (3): 510-544.
[21] Bond, Timothy N., and Kevin Lang. 2018. “The Black-White Education Scaled Test-Score Gap in Grades K-7.” The Journal of Human Resources 53 (4): 891-917.
[22] See the following studies:
- Clotfelter, Charles T., Helen F. Ladd, and Jacob L. Vigdor. 2009. “The Academic achievement Gap in Grades 3 to 8.” The Review of Economics and Statistics 91 (2) 398-419.
- Reardon, Sean F., and Claudia Galindo. 2009. “The Hispanic-White achievement Gap in Math and Reading in the Elementary Grades.” American Educational Research Journal 46 (3): 853-96.
- Reardon, Sean F., Joseph P. Robinson-Cimpian, and Ericka S. Weathers. 2015. “Patterns and Trends in Racial/Ethnic and Socioeconomic Academic Achievement Gaps.” In Handbook of Research in Education Finance and Policy, edited by Helen F. Ladd and Margaret E. Goertz, 499-518. New York: Routledge.
[23] Reardon, Sean F., Erick S. Weathers, Erin M. Fahle, Heewon Jang, and Demetra Kalogrides. 2022. “Is Separate Still Unequal? New Evidence on School Segregation” Stanford Center for Education Policy Analysis (CEPA) Working Paper No. 19-06. Retrieved from https://cepa.stanford.edu/sites/default/files/wp19-06-v082022.pdf.
[24] U.S. Government Accountability Office. 2022. “K-12 Education: Student Population Has Significantly Diversified, but Many Schools Remain Divided Along Racial, Ethnic, and Economic Lines.” GAO-22-104737. Retrieved from https://www.gao.gov/products/gao-22-104737.
[25] Card, David, and Jesse Rothstein. 2007. “Racial Segregation and the Black-White Test Score Gap.” Journal of Public Economics 91 (11-12): 2158-2184.
[26] Bacher-Hicks, Andrew, Stephen B. Billings, and David J. Deming. 2019. “The School to Prison Pipeline: Long-Run Impacts of School Suspensions on Adult Crime.” NBER Working Paper 26257.
[27] U.S. Government Accountability Office. 2028. “K-12 Education: Discipline Disparities for Black Students, Boys, and Students with Disabilities.” GA)-18-258. Retrieved from https://www.gao.gov/products/gao-18-258.
[28] Gershenson, Seth, Cassandra M. D. Hard, Joshua Hyman, Constance A. Lindsay, and Nicholas W. Papageorge. 2022. “The Long-Run Impacts of Same-Race Teachers.” American Economic Journal: Economic Policy 14 (4): 300-342.
[29] Papageorge, Nicholas W., Seth Gershenson, and Kyung Min Kang. 2020. “Teacher Expectations Matter.” The Review of Economics and Statistics 102 (2): 234-251.
[30] See the following studies on the importance of pre-college characteristics for racial gaps in college attendance and completion:
- Flores, Stella M., Toby J. Park, and Dominique J. Baker. 2017. “The Racial College Completion Gap: Evidence from Texas.” The Journal of Higher Education 88 (6): 894-921.
- Hinton, Ivora, Jessica Howell, Elizabeth Merwin, Steven N. Stern, Sarah Turner, Ishan Williams, and Melvin Wilson. 2010. “The Educational Pipeline for Health Care Professionals.” The Journal of Human Resources 45 (1): 116-156.
- Light, Audrey, and Wayne Strayer. 2002. “From Bakke to Hopwood: Does Race Affect College Attendance and Completion?” The Review of Economics and Statistics 84 (1): 34-44.