Eric Van Nostrand, P.D.O. Assistant Secretary for Economic Policy
Matthew Ashenfarb, Research Economist, Office of Climate & Energy Economics
November 29, 2023
The Inflation Reduction Act (IRA) is the most significant investment in reducing carbon emissions in American history. As we wrote earlier this month, the IRA is designed to boost economic growth while addressing climate change. This blog highlights another element of the IRA’s economic impact: the geographic distribution of its investments. IRA investments are delivering more clean investment to left-behind places, communities at the forefront of fossil fuel energy production and those that have benefited least from the economic growth of the past few decades. The IRA’s combined focus on expanding our productive capacity, mitigating climate change, and addressing inequality is central to the strategy Secretary Yellen has called “modern supply-side economics.”
We analyze the geographic and socioeconomic distribution of clean investment announcements using data from the Clean Investment Monitor (CIM). The CIM is a joint product of the Massachusetts Institute of Technology and the Rhodium Group that catalogs and maps U.S. clean energy investments before and after the IRA passed. This work reflects an update and extension to our initial place-based analysis in The Inflation Reduction Act and U.S. Business Investment (August 2023). We offer two key conclusions:
- It is well-established that clean investments grew meaningfully after the IRA passed. But we find that clean investments grew especially quickly in “Energy Communities,” areas with a history of fossil fuel production, where clean industry potential exists but opportunity has been scarce.
- Since the IRA passed, clean investments have been landing in more economically disadvantaged counties: those with below average wages, incomes, employment rates, and college graduation rates. More than 80 percent of post-IRA clean investments have gone to counties with below-average wages; more than 85 percent have gone to counties with below-average college graduation rates. This is true for all regions of the country and all technologies supported by the IRA; the investment and benefits tend to accrue to disadvantaged counties.
Investments in Energy Communities
The IRA aims to increase clean energy investment throughout the United States, and especially in communities that historically relied on fossil fuels for employment and wages. Towards these goals, the IRA includes a tax credit for clean electricity investment and production, and a bonus that increases the tax credit for clean electricity investment and production in “Energy Communities.” Energy Communities are defined as areas with a coal mine or coal plant closure, areas that had high fossil fuel employment and a recently high unemployment rate, or brownfield sites (such as land that is underutilized due to pollution from former industrial use).[1]
Is the Energy Community Bonus shifting new clean energy investment to Energy Communities, as intended? While it is still early in the energy transition supported by the IRA, there are some preliminary data to help answer the question, and they suggest the answer is yes. The MIT/Rhodium Clean Investment Monitor documents announcements of clean investment from 2018 through June 2023. The data include information on project locations and sectors, which we use to identify whether the projects are in Energy Communities and whether the projects are in sectors eligible for the Energy Community Bonus.[2]
To evaluate the Bonus, we compare changes in Bonus-eligible investment announcements in Energy Communities and Non-Energy Communities before and after the IRA.[3]The final dataset includes 4,729 announcements of investments totaling over $352 billion. This includes 713 post-IRA projects worth over $101 billion. Notably, the Clean Investment Monitor team has recently published its own analysis of the specific communities receiving clean investments.[4] We build on this work with a before-and-after analysis and by comparing growth in Energy Communities to growth in non-Energy Communities.
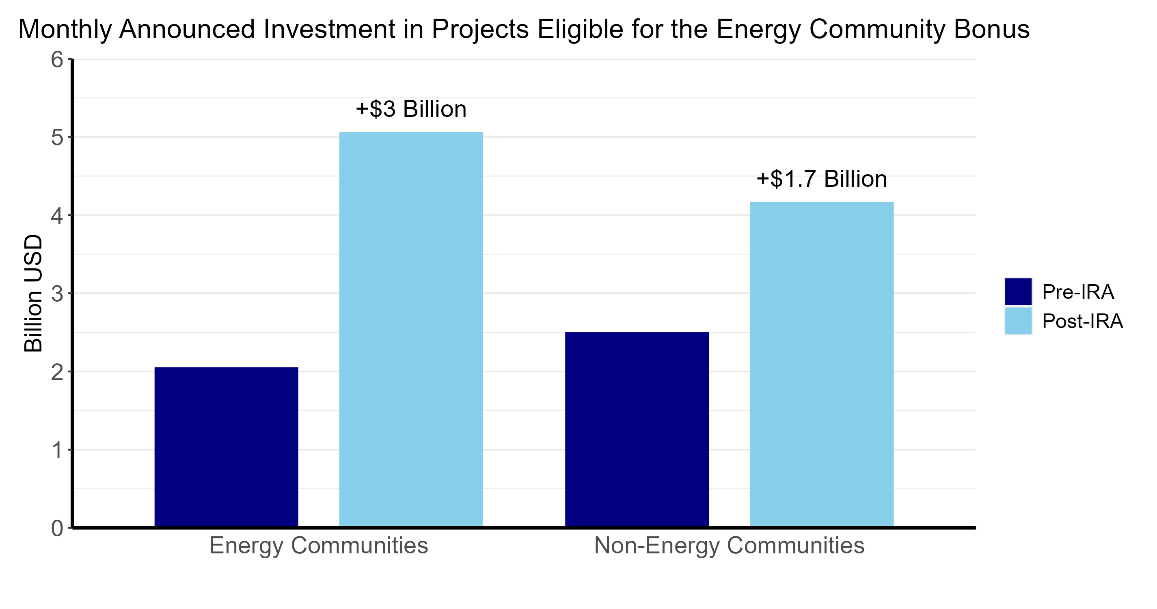
Figure 1. After the IRA passed, clean investments grew broadly, but they grew especially quickly in Energy Communities.
Source: Rhodium Group and MIT Center for Energy and Environmental Policy Research (CEEPR) Clean Investment Monitor, accessed November 2023. Pre-IRA data date back to 2018. Post-IRA data cover August 2022 through June 2023. Energy Communities from the DOE Energy Community Tax Credit Bonus Map (accessed October, 2023), with cartographic boundaries from 2020 Census Tracts, 2010 MSAs, and 2020 county definitions of non-MSAs, following Treasury and IRS Notice 2023-29 and Appendix A of the Notice.
Figure 1 shows that after the IRA was passed, clean investment grew more quickly in Energy Communities than in non-Energy Communities. Before the IRA was signed in August 2022, announced bonus-eligible investment was about $2 billion per month in Energy Communities and $2.5 billion per month in the rest of the United States. After the IRA was signed, clean energy investment announcements increased to $5 billion per month in Energy Communities and about $4 billion per month in non-Energy Communities. Put simply, clean energy investment is booming throughout the United States, and investment is growing even faster in Energy Communities.[5]
Economic Characteristics of Counties Receiving Clean Investments
Analyzing broader measures, we again find that clean investments are concentrated in economically disadvantaged counties. We again turn to the Clean Investment Monitor data, with 5,161 active post-2017 project announcements investing $624 billion, of which 869 announcements and $199 billion are post-IRA.[6] The following figures plot the socioeconomic distributions of clean investment dollars and compare distributions to the national aggregate measures.[7]
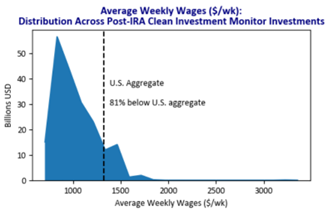
Figure 2 shows that 81% of clean investment dollars announced since the IRA passed have been for projects in counties with below-average weekly wages.
Figure 2. 81% of clean investment dollars since the IRA passed land in counties with below-average weekly wages.
Source: Clean Investment Monitor; Quarterly Census of Employment & Wages; U.S. Treasury calculations. Average weekly wages reflect 2022 annual averages.
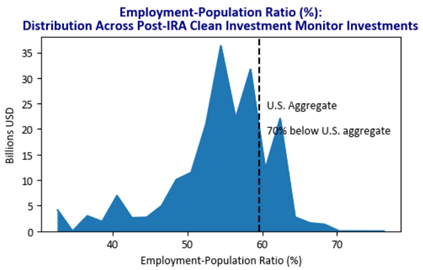
Not only are average wages lower in places receiving clean energy investments, but employment is lower as well. Figure 3 shows that nearly three-quarters of investments are being announced in counties where a smaller share of the population is employed, suggesting weaker labor markets overall than the national aggregate.
Figure 3. 70% of clean investment dollars since the IRA passed are in counties where a smaller share of the population is employed.
Source: Clean Investment Monitor; Census American Community Survey 2021; U.S. Treasury calculations. Employment-population ratios reflect 2021 annual averages.
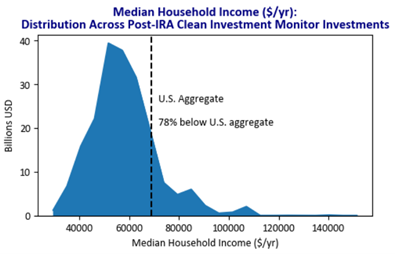
In addition to having lower wages and employment, Figure 4 shows that counties attracting more clean energy investment announcements also have lower household incomes.
Figure 4. 78% of clean investment dollars since the IRA passed flow to counties with below-average median household incomes.
Source: Clean Investment Monitor; Census American Community Survey 2021; U.S. Treasury calculations. Median household income is the 2021 value.
Finally, as well as having lower wages, employment, and household incomes, Figure 5 shows that the majority of announced clean investment is for projects in counties with below average college graduation rates.
Figure 5. 86% of clean investment dollars since the IRA passed are landing in counties with below-average college graduation rates.

Source: Clean Investment Monitor; Census American Community Survey 2021; U.S. Treasury calculations. College graduation rate is defined as a Bachelor’s degree or higher.
Importantly, these findings are generally consistent across regions of the country. Within each of the four major Census regions, most clean investments are located in counties with below-average median household income and most are in counties with below-average college graduation rates. In the South, 81 percent are in below-average income counties and 90 percent are in below-average graduation counties. In the West, 66 percent are in below-average income counties and 75 percent are in below-average graduation counties. In the Northeast, 77 percent are in below-average income counties and 71 percent are in below-average graduation counties. And in the Midwest, 81 percent are in below-average income counties and 88 percent are in below-average graduation counties.
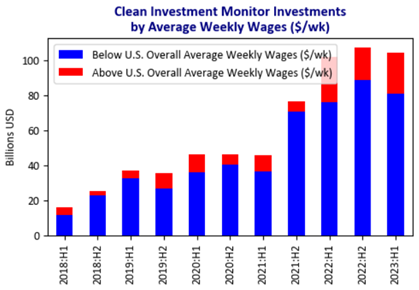
Figure 6 shows a time series of announced clean investments according to whether they are in counties with average wage above or below the national average. Total clean energy investments have been meaningfully higher in aggregate since the second half of 2021—and especially since the IRA passed in mid-2022. But importantly, most of that growth is accounted for by investments in counties with below-average wages.
Figure 6. Total clean energy investments have risen in recent years, especially in low-wage counties.
Source: Clean Investment Monitor; Quarterly Census of Employment & Wages; U.S. Treasury calculations. Average weekly wages reflect 2022 annual averages.
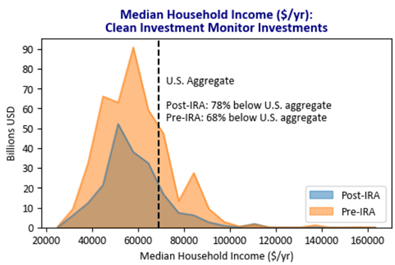
Another way to visualize this dynamic is presented in Figure 7, which compares the median household income distribution of clean investment dollars in the post-IRA era with the pre-IRA era. Clean investments generally flow to poorer communities, but this effect has been especially pronounced since the IRA passed: 68 percent of investments went to low-income counties before the IRA passed, and 78 percent are going to low-income counties since.
Figure 7. The share of clean investment dollars going to low-income counties rose from 68 percent to 78 percent when the IRA passed.
Source: Clean Investment Monitor; Census Bureau; U.S. Treasury calculations. Median household income is the 2021 value. “Pre-IRA” refers to clean investments from 2018, when the Clean Investment Monitor dataset begins through July 2023, and “Post-IRA” refers to August 2023 and later.
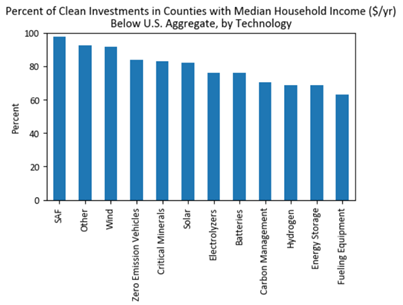
Moreover, Figure 8 shows these investment trends are happening across all the technologies supported by IRA dollars, including zero emission vehicles, carbon management, and sustainable aviation fuel (SAF), among others. The post-IRA data show the trend appears across each investment type, without concentration in just one or two types.
Figure 8. Clean investment dollars are landing mostly in low-income counties across each of the twelve technologies categorized by the Clean Investment Monitor.
Source: Clean Investment Monitor; Census Bureau; U.S. Treasury calculations. Median household income is the 2021 value.
Conclusion
The Inflation Reduction Act is designed to address climate change while growing the economy. But the IRA was also crafted to grow the economy from the bottom-up and the middle-out, not just on aggregate. Increasing economic growth, mitigating climate change, and improving energy security while benefiting American communities that have historically been left behind is a key element of President Biden’s economic agenda. Clean investments generally, and the IRA specifically, steer investment dollars to Energy Communities with economies historically reliant on fossil fuels and to counties with lower-income and less-educated populations that stand to benefit from increased economic opportunity.
[2] Further guidance on Energy Community Bonus qualifications is available from the IRS.
[3] Bonus-eligible investments in the dataset include utility-scale batteries, solar plants, wind farms, energy storage, hydroelectric facilities, geothermal, biomass, and landfill gas. We define Energy Communities based on the DOE Energy Community Tax Credit Bonus Map. The map omits brownfield sites, and there are no comprehensive data on brownfield sites, so we do not use the brownfield site definition to identify bonus-eligible locations. We trim the data to include only post-2017, non-cancelled announcements geocoded to overlap with a U.S. county.
[4] Lily Bermel, Brian Deese, Michael Delgado, Leandra English, Yeric Garcia, Lisa Hansmann, Trevor Houser, Nakya Stewart, and Harold Tavarez. Clean Investment at the Community Level.
[5] The analysis in the figure uses pre-IRA data back to 2018. Restricting the analysis to equal time intervals – 11 months pre-IRA and 11 months post-IRA – produces qualitatively similar results. It shows Bonus-eligible investment grows faster in Energy Communities by $1 billion per month, whereas the analysis in the figure shows Bonus-eligible investment grows faster in Energy Communities by $1.3 billion per month.
[6] In addition to the clean energy investment that qualifies for the Energy Community Bonus, this analysis adds clean manufacturing, hydrogen, electrolyzers, sustainable aviation fuels, critical minerals, and zero emission vehicle facilities.
[7] This work updates the place-based analysis first presented in The Inflation Reduction Act and U.S. Business Investment (August 2023). That analysis focused on investment announcements catalogued on the Administration’s Invest.gov; this analysis uses the Clean Investment Monitor data, including facilities that were previously announced and are presently under construction or operational. One might argue that it is to be expected that “most” investments are landing in counties with worse-than-average economic data, since most counties overall have worse-than-average data. But that is, in fact, the point: the distribution of clean investments looks like the distribution of counties overall, a much more equitable distribution than concentrating investments in high-population, wealthier counties.
