In a recent blog post, we described how clean investments incentivized by the Inflation Reduction Act (IRA) are going to disadvantaged communities, including areas with low incomes, low educational attainments, high unemployment rates, and so-called “Energy Communities”— areas with local economies historically reliant on fossil fuels for employment, wages, and tax revenue. Since we published that blog, the Massachusetts Institute of Technology and Rhodium Group Clean Investment Monitor (CIM) has released an additional data, adding investments announced between July and December 2023. This post updates our previous analysis using the most recent data, confirming investments continue to be concentrated in disadvantaged communities.
ACCELERATING CLEAN GROWTH ENERGY COMMUNITIES
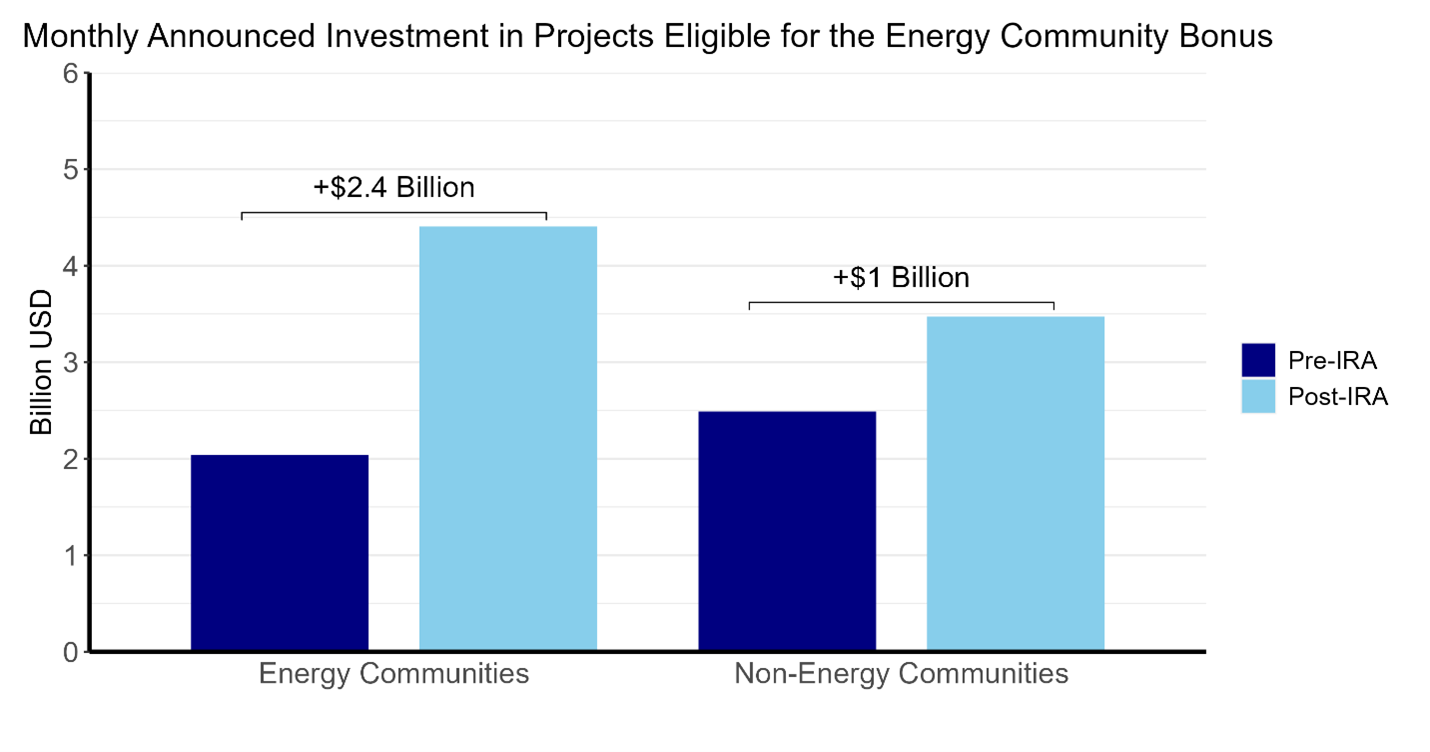
The IRA defines Energy Communities as areas historically reliant on fossil fuels for employment, wages, or tax revenue. The Energy Community Bonus offers a supplemental tax credit to clean electricity investment and production in those places.[1] Before the IRA passed in August 2022, an average of $2 billion per month of clean electricity investment was announced in areas eligible for the Energy Community Bonus and $2.5 billion per month throughout the rest of the U.S. (the dark blue bars in Figure 1).[2] After the IRA passed, those numbers ballooned to nearly $4.5 billion per month in Energy Communities and to $3.5 billion in the rest of the U.S. (the light blue bars in Figure 1), constituting increases of $2.4 billion per month in Energy Communities and a $1 billion per month in the rest of the U.S. Clean investment announcements are growing throughout the U.S., with especially strong growth in Energy Communities.

Source: Rhodium Group and MIT Center for Energy and Environmental Policy Research (CEEPR) Clean Investment Monitor, accessed February 2024. Pre-IRA data date back to 2018. Post-IRA data cover August 2022 through December 2023. Energy Communities from the DOE Energy Community Tax Credit Bonus Map (accessed October 2023), with cartographic boundaries from 2020 Census Tracts, 2010 MSAs, and 2020 county definitions of non-MSAs, following Treasury and IRS Notice 2023-29 and Appendix A of the Notice.
INVESTMENT IN DISADVANTAGED COMMUNITIES
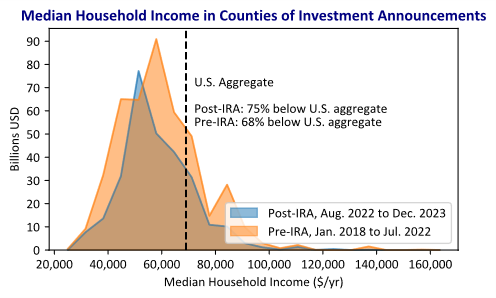
The IRA clean investments are flowing not only to Energy Communities, but also to disadvantaged communities defined more broadly. Figure 2 compares the pre- and post-IRA distributions of median incomes in counties with clean investment announcements.[3] The dashed line indicates the U.S. aggregate median income. Before the IRA, 68% of announced investments in clean technologies were in counties with median incomes below the U.S. aggregate median income. After the IRA, 75% of announced clean investments have been in counties with median incomes below the U.S. aggregate median.

Source: Clean Investment Monitor; Census Bureau; U.S. Treasury calculations. Median household income is the 2021 value.
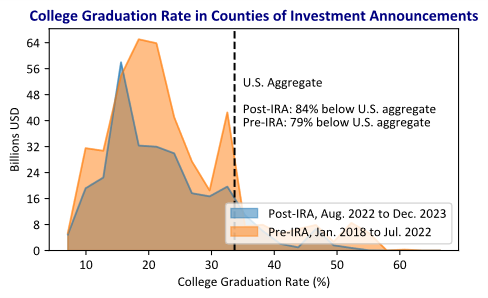
Figure 3 describes a similar analysis based on education rather than income. Before the IRA passed, 79% of announced clean investments were in counties with college graduation rates below the U.S. aggregate rate. Since the IRA passed, 84% of announced clean investments have been in counties with college graduation rates below the U.S. aggregate rate.
Clean investments have historically been concentrated in places with low incomes and educational attainments, and this is especially true since the IRA passed.

Source: Clean Investment Monitor; Census Bureau; U.S. Treasury calculations. College graduation rate is the 2021 value.
[1] See our previous blog post for more details.
[2] We filter the announcements to only include solar, wind, and electricity storage because these technologies are eligible for the Energy Community Bonus credits. The pre-IRA data extend from January 2018 to July 2022, and the post-IRA data August 2022 to December 2023. Restricting the pre-IRA dates to an equal time interval as the post-IRA dates (i.e., June 2021 to July 2022) produces similar results.
[3] Demographic data are from the 2021 American Community Survey. Figures 2 and 3 include all investment announcements, not just those eligible for the Energy Community Bonus as in Figure 1. The pre-IRA data date back to 2018.
