
Arik Levinson, Deputy Assistant Secretary for Climate & Energy Economics
Karl Dunkle Werner, Economist, Office of Microeconomic Analysis
Matthew Ashenfarb, Research Economist, Office of Climate & Energy Economics
Annelise Britten, Senior Policy Advisor, Office of Economic Policy
The Inflation Reduction Act (IRA) represents the United States’ biggest investment to date in fighting climate change. In recent months, we have considered two important economic aspects of the IRA: its role as a pro-growth policy that expands our economy while reducing greenhouse gas emissions, and its role as a place-based policy that directs climate investments to parts of the country that have been historically reliant on the fossil fuel economy and that have relatively low wages, employment, and college graduation rates.
In this post, we make a different point: The economic case for the IRA is stronger than sometimes realized. Common projections of the IRA’s effect on reducing greenhouse gas pollution underestimate the IRA’s benefits, and typical projections of the IRA’s effect on the federal budget overstate the IRA’s costs to the U.S. economy.
- The IRA will yield cumulative global economic benefits from reduced greenhouse gas pollution of over $5 trillion from the present to 2050. That understates the IRA’s benefits by counting only climate benefits, omitting many of the benefits we described earlier, including the fact that the IRA will also reduce local air pollution, providing domestic health and productivity gains to the United States. Lower-bound estimates of the benefits from those local pollution reductions range from $20 to $49 billion in 2030 alone, compared to that year’s climate benefits estimated at $137 billion.[1]
- The IRA’s projected costs to the U.S. federal budget are mostly reductions in taxes owed by U.S. taxpayers or increases in federal payments to those taxpayers. Those are important but overstate the true resource costs the IRA imposes on the U.S. economy, because they only include one side of each transaction. Tax credits paid by the federal government are received as benefits by American drivers who purchase electric cars, homeowners who install efficient heat pumps, and investors who build factories and power plants to equip and fuel the clean energy transition
The Benefits of the IRA: Worldwide Climate Benefits and Improved Air Quality in the United States
Burning fossil fuels—for electricity, transportation, manufacturing, or any other purpose—causes two major environmental problems. One is the global climate damages caused by greenhouse gases, or CO2e. A second involves damage to local air quality here in the United States, including from sulfur dioxide, nitrogen oxides, volatile organic compounds, and particulate matter.
Much of the attention paid to the IRA’s environmental benefits has involved the first problem, global climate change from greenhouses gases. A recent paper in Science summarizes nine independent, state-of-the-art analyses that forecast the CO2e emissions reductions the IRA will provide.[2] Three of the models focus solely on the electricity sector. Six are more comprehensive, capturing not just clean electricity but also transportation and electric vehicles, energy efficiency, carbon capture, and clean hydrogen.
Figure 1 depicts the effect of the IRA on CO2e emissions. The thick black line from 2000 until 2021 shows how historical emissions have been declining for the past 20 years. The colored lines through 2050 depict projected future emissions, with and without the IRA, based on the six most comprehensive models summarized by Science; the thinner colored lines depict each of the six models projections separately; and the thick blue lines depict the average of the six models’ projections with and without the IRA.[3] The green shaded area between the two averages represents the total greenhouse gases (CO2e) that the IRA is projected to mitigate from now through 2050, 21 billion tons.
Figure 1. Projected Greenhouse Gas Emissions Reductions |

|
| Source: Historic net emissions for 2000-2021 from EPA Emissions Inventory (2022). Projected future emissions based on Bistline et al. (2023). Each pair of dashed and solid lines represents the projections from one of the six models, with and without the IRA. The thick lines represent the simple averages of the six. |
What are the economic benefits of the IRA’s greenhouse gas reductions? Each ton of carbon emitted causes additional future economic damages here in the United States and around the world in the form of floods, hurricanes, and other extreme weather. Each ton not emitted (or captured and permanently stored) reduces those damages, providing economic benefits.
As greenhouse gases accumulate in the atmosphere and temperatures rise, each new ton of greenhouse gases will cause a larger temperature increase, and each temperature increase will cause more damages. And as countries’ populations and incomes grow, each hurricane or drought will affect more people and property, further magnifying damages. As a consequence, the costs of pollution and benefits of mitigation will increase each year. The U.S. government has long had an official measure of the value of those avoided damages, which the U.S. Environmental Protection Agency (EPA) recently updated: $212 per ton in 2025, rising steadily to $308 per ton in 2050.[4]
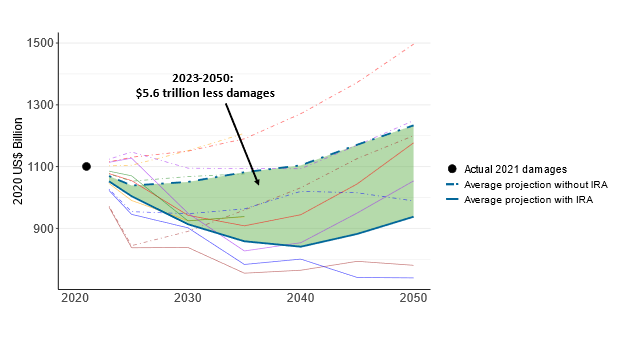
To describe how the economic benefits of the IRA’s greenhouse gas reductions will change over time, Figure 2 multiplies each ton of projected emissions reductions depicted in Figure 1 by the EPA’s assessment of the corresponding year’s value of avoided damages. The green shaded area in Figure 2 depicts those benefits all the way to 2050, and they amount to $5.6 trillion.
Figure 2. Climate Benefits of the IRA |
|
| Source: Projected emissions based on Bistline et al. (2023). Value of benefits based on EPA Social Cost of Greenhouse Gases (2023). |
Comparison of these figures reveals an important point. Figure 1 shows that even without the IRA, U.S. emissions are projected to decline. The IRA accelerates a transition already underway. But as shown in Figure 2, without the IRA, the monetary damages caused by U.S. emissions are projected to rise. That’s because the economic damage caused by each ton of greenhouse gases grows faster over time than U.S. emissions without the IRA fall, meaning the net effect shown by the top line in Figure 2 is rising global damages. The IRA reverses that. Over the next decade, while the bulk of the tax credits are in force, the IRA causes projected global damages to fall.
The IRA’s $5.6 trillion benefit depicted in Figure 2 represents worldwide gains, not just those experienced in the United States. That’s appropriate, for reasons explained in Box 1. But it’s also true that some portion of that $5.6 trillion will directly benefit people residing in the United States. An influential 2018 study estimates that U.S. residents will suffer about 11% of global climate damages, with varying assumptions leading to values ranging from 2.7 to 44%.[5] Taken literally, that means 11% of the $5.6 trillion global benefits in Figure 1, or $640 billion, involve direct U.S. benefits, with a range anywhere from $150 billion to $2.5 trillion.
But again, as Box 1 explains, assessing the IRA correctly requires using its global benefits, the whole $5.6 trillion. And importantly, even that $5.6 trillion valuation understates the IRA’s merits by excluding some direct benefits to the United States we covered in an earlier post. One critical exclusion is the improved health and productivity that will follow reductions in local air pollutants like particulates and smog.
Whose climate benefits?
Local Pollution Benefits of the IRA
Recent research provides abundant examples of harms from local air pollution.[10] Airborne particulates reduce worker productivity.[11] Pollution causes people to work fewer hours,[12] perform worse on tests of cognition,[13] and even have more car accidents.[14] And the damages are long-lasting. People exposed to more pollution when they are in utero, as small children, or during their later lives, are less likely to attend college, go on work and earn less at their jobs, and are more likely to suffer from dementia more when they are older.[15]
Because these local pollutants are emitted alongside greenhouse gases that affect the global climate, government climate policies like the IRA that limit greenhouse gas emissions can have additional benefits of improving local air quality.
Figure 3 shows how the IRA will deliver benefits in the United States by reducing the risk of fatalities from sicknesses caused by airborne particulates, as reported by three separate analyses. The estimated benefits for 2030 range from $20 billion (counting only reductions in sulfur dioxide and nitrogen oxides from the electric power sector) to $49 billion (including effects from electric vehicles, energy efficient buildings, and others). This is just for one year – 2030 – and does not include estimates from previous or subsequent years. Like the IRA’s climate benefits, we can expect the IRA’s local air pollution benefits to also grow over time, as the investments encouraged by the IRA begin to pay returns and existing gas and diesel-powered cars and trucks and fossil-fuel powered appliances and power plants are replaced. One of the three studies (REPEAT) forecasts that the IRA’s pollution reductions will be even larger in subsequent years, with fatality risk reductions valued 150% higher in 2035 than in 2030.
All the valuations in Figure 3 are also underestimates because they include only the IRA’s reductions in fatality risk, omitting other important benefits like improved health and productivity, as well as benefits from reductions in other types of local pollution. One study, by Energy Innovation, also examined the IRA’s effect on non-fatal illnesses. It projects 85,900 fewer asthma attacks in 2030, 3,700 fewer heart attacks, 1,700 fewer hospital admissions, and 350,700 fewer lost workdays.[16]
Figure 3. Local Air Pollution Benefits of the IRA |

|
| Sources: Resources for the Future (RFF) RFF: “Beyond Clean Energy: The Financial Incidence and Health Effects of the IRA” Table 5. Energy Innovation (EI): “Updated Inflation Reduction Act Modeling Using the Energy Policy Simulator” Table 5. Rapid Energy Policy Evaluation and Analysis Toolkit (REPEAT): “Explore Our Results” comparison of IRA (mid-range) vs IIJA Only. Mortality risk reductions valued using RFF’s approach, accounting for expected economic growth. Graph shows undiscounted values: $15.3 million for 2030 and $16.5 million for 2035, both in real 2020 USD. |
Like any forecast, all of these involve uncertain predictions of the future. Nevertheless, they give a sense of the scale of the IRA’s domestic pollution benefits relative to its global climate benefits. The global climate benefits of the IRA for 2030, depicted in Figure 2, amount to $137 billion. Just one part of the additional local benefits, fatality risk reduction from improved local air quality, would add another 15 to 35% on top of those carbon reduction benefits.
Fiscal Cost Estimates Overstate the IRA’s True Cost to Our Economy
Just as the global value of the IRA’s projected carbon reductions understate its overall benefits, forecasts of the IRA’s fiscal costs overstate its true resource costs to the U.S. economy. Fiscal costs are reductions in federal revenues or increases in federal payments. They are monetary payments from the government to individuals, with no net loss to the country. Resource costs are net losses to the aggregate U.S. economy from things like distorted incentives caused by the need to raise taxes, or damages to people and infrastructure from severe weather.
Multiple groups have forecast the IRA’s fiscal costs over its 10-year life. In November 2022, Credit Suisse forecast that the IRA’s fiscal cost to the federal budget would amount to more than $800 billion over 10 years. In March of 2023, researchers at the Brookings Institution estimated the IRA fiscal cost to be $780 billion through 2031. That same month, Goldman Sachs forecast the IRA fiscal cost at $1.2 trillion. And in April, University of Pennsylvania researchers expected the IRA fiscal cost to be just over $1 trillion from 2023 to 2032.[17] In addition, CBO recently increased its projected fiscal costs of energy related tax provisions, making their forecast roughly in line with these outside projections.[18]
Estimating and understanding fiscal costs is important. The fiscal costs of a program describe its effect on the federal government’s annual deficit and the national debt. And fiscal costs can affect inequality, because some households benefit financially while others incur higher taxes or higher interest rates to finance the debt. The IRA takes significant steps to ensure that the distribution of its tax incentives is equitable. For example, high-income taxpayers are ineligible to receive tax rebates for purchasing electric cars. Also, the IRA includes tax credit bonuses designed to steer clean investments to low-income communities and communities historically reliant on the fossil fuel economy, or “Energy Communities.” Our recent blog post shows that most new clean investment announcements are in these disadvantaged communities.
But for the purposes of a benefit-cost analysis to evaluate the IRA, fiscal costs are the wrong costs to consider. That’s because the tax credits paid by the federal government are received as benefits by American drivers who purchase electric cars, homeowners who install efficient heat pumps, and investors who build factories and power plants to equip and fuel the clean energy transition. The bulk of the IRA’s fiscal costs are these types of tax credits, that is, reductions in taxes paid by individuals and businesses. Each of those is a cost to the federal government, matched by an equal benefit to the recipient, with no net cost to the economy.
Economists call money exchanged between parties, such as tax credits, “transfers.” Decades of federal guidance has been clear that transfers are not economic resource costs. The Office of Management and Budget (OMB) recently issued guidance for how federal agencies should evaluate regulations using benefit–cost analysis.[19] It devotes a whole section to transfers, including “tax payments from individuals or businesses to the government … and tax refunds from the government to individuals or businesses.” OMB recommends that analyses of tax changes either exclude both sides of the transaction, or include both. In the case of the IRA’s $7,500 electric vehicle credit, that means excluding the $7,500 entirely, or counting the money both as a benefit to the taxpayer and a cost to the government.
The previous version of the OMB guidance, in effect from 2003 until last year, made the same point. “Transfer payments are monetary payments from one group to another that do not affect total resources available to society.” [20] It recommended that analysts examining federal regulations “not include transfers in the estimates of the benefits and costs of a regulation. Instead, address them in a separate discussion of the regulation’s distributional effects.”
In fact, simple economic theory shows that the fiscal costs of a subsidy will always exceed its true economic costs. That’s why it’s particularly noteworthy when studies describe the climate benefits of the IRA as being larger than those fiscal costs. The Goldman Sachs analysis calculated that each ton of greenhouse gases abated by the IRA would cost the U.S. government $52. Similarly, the Brookings report projected that each ton reduced by the IRA’s power sector subsidies would cost $36 to $87 of government funds. Those outlays fall far short of the EPA’s social cost of carbon dioxide, which rises from $200 to $300 per ton. So, according to these models, the benefits of the IRA far exceed its fiscal costs. And according to economic theory the benefits will exceed the true economic costs by even more.
[1] Unless noted, all dollar figures related to benefits or social costs are real (inflation-adjusted) 2020 USD.
[2] Bistline, John, et al. 2023. “Emissions and energy impacts of the Inflation Reduction Act” Science 380(6652):1324-1327.
[3] The Science article’s models we use for Figure 1 are based on Energy Innovation’s Energy Policy Simulator (EPS-EI), the U.S. National Energy Technology Laboratory’s implementation of the International Energy Agency’s MARKAL model (MARKAL-NETL), the Electric Power Research Institute’s Regional Economy, Greenhouse Gas, and Energy model (REGEN-EPRI), Evolved Energy Research’s Regional Investment and Operations model (RIO-REPEAT), the Rhodium Group’s implementation of the U.S. Energy Information Administration’s National Energy Modeling System (NEMS-RHG), and the Center for Global Sustainability’s Global Change Analysis Model (GCAM-CGS). Only the first four have model projections for 2040 to 2050, so the forecast for those years is an average of only those models.
[4] EPA Report on the Social Cost of Greenhouse Gases: Estimates Incorporating Recent Scientific Advances, Table A.5.1, in 2020 USD and using 2% initial discount rate.
[5] Ricke, Katharine, Laurent Drouet, Ken Caldeira, and Massimo Tavoni. 2018. “Country-level social cost of carbon” Nature Climate Change p. 895-900. https://doi.org/10.1038/s41558-018-0282-y. Authors’ calculations of the US country social cost of carbon share of the global social cost of carbon.
[6] U.S. Interagency Working Group on the Social Cost of Greenhouse Gases. 2021. “Technical Support Document: Social Cost of Carbon, Methane, and Nitrous Oxide – Interim Estimates under Executive Order 13990.” https://www.whitehouse.gov/wp-content/uploads/2021/02/TechnicalSupportDocument_SocialCostofCarbonMethaneNitrousOxide.pdf.
[7] Barrett, Scott. 2011. “Avoiding disastrous climate change is possible but not inevitable.” PNAS 108 (29): 11733-11734.
[8] Kotchen, Matthew J. 2018. Which social cost of carbon? A theoretical perspective. Journal of the Association of Environmental and Resource Economists, 5(3), 673-694.; Carleton, T., & Greenstone, M. 2021. Updating the United States Government's Social Cost of Carbon. University of Chicago, Becker Friedman Institute for Economics Working Paper, (2021-04).
[9]Houser, Trevor, Kate Larsen, and Michael Greenstone. 2021. “Does the World Free Ride on US Pledges to Reduce Greenhouse Gas Emissions? Evidence from the Paris Climate Agreement” University of Chicago Becker Friedman Institute for Economics Working Paper No. 2023-146.
[10] Aguilar-Gomez, Sandra, Holt Dwyer, Joshua Graff Zivin, and Matthew Neidell. 2022. “This Is Air: The ‘Nonhealth’ Effects of Air Pollution.” Annual Review of Resource Economics 14: 403-425.
[11] Chang, Tom, Joshua Graff Zivin, Tal Gross, and Matthew Neidell. 2016. “Particulate Pollution and the Productivity of Pear Packers.” American Economic Journal: Economic Policy 8 (3): 141-169.; He, Jiaxiu, Haoming Liu, and Alberto Salvo. 2019. “Severe Air Pollution and Labor Productivity: Evidence from Industrial Towns in China.” American Economic Journal: Applied Economics 11 (1): 173-201.
[12] Aragón, Fernando, Juan Jose Miranda, and Paulina Oliva. 2017. “Particulate matter and labor supply: The role of caregiving and non-linearities.” Journal of Environmental Economics and Management 86: 295-309; Holub, Felix, Laura Hospido, Ulrich J. Wagner. 2021. “Urban air pollution and sick leaves: evidence from social security data.” Social Science Research Network, August 21, 2021.
[13] Zhang, Xin, Xi Chen, and Xiaobo Zhang. 2018. The impact of exposure to air pollution on cognitive performance. Proceedings of the National Academy of Sciences, 115(37), pp.9193-9197.; Roth, Sefi J. 2018. “The effect of indoor air pollution on cognitive performance: Evidence from the UK.” Working paper. Accessed August 11, 2023. https://personal.lse.ac.uk/roths/JMP.pdf.
[14] Sager, Lutz. 2019. “Estimating the effect of air pollution on road safety using atmospheric temperature inversions.” Journal of Environmental Economics and Management 98: 102-250.
[15] Isen, Adam, Maya Rossin-Slater, and W. Reed Walker. 2017. “Every breath you take—every dollar you’ll make: The long-term consequences of the Clean Air Act of 1970.” Journal of Political Economy 125 (3): 848-902.; Voorheis, John. 2017. “Air quality, human capital formation and the long-term effects of environmental inequality at birth.” Center for Administrative Records Research and Applications, U.S. Census Bureau, working paper 2017-05.; Bishop, Kelly, Jonathan Ketcham, Nicolai Kuminoff. 2023. “Hazed and Confused: The Effect of Air Pollution on Dementia” Review of Economic Studies 90(5): 2188-2214.
[16] Mahajan, Megan, Olivia Ashmoore, Jeffrey Rissman, Robbie Orvis, and Anand Gopal. 2022. “Updated Inflation Reduction Act Modeling Using the Energy Policy Simulator.” Energy Innovation, August 23, 2022. https://energyinnovation.org/publication/updated-inflation-reduction-act-modeling-using-the-energy-policy-simulator/.
[17] We report these studies’ original dollar figures, without applying any inflation adjustment.
[18] Congressional Budget Office. 2024. The Budget and Economic Outlook: 2024 to 2034 (accessed February 11, 2024). The CBO forecast now incorporates the EPA’s proposed vehicle emissions standards that would begin with the 2027 model year, with a 50-percent weight, following CBO’s typical practice for rules that are not yet finalized.
[19] Office of Management and Budget. 2023. Circular A-4, (accessed January 18, 2024).
[20] Office of Management and Budget. 2003. Circular A-4 (archives.gov), (accessed January 18, 2024).