
(Archived Content)
To view or print the PDF content on this page, download the free Adobe® Acrobat® Reader®.
2006-6-19-13-54-55-25176
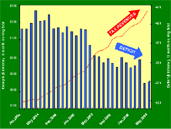
The President's pro-growth policies are working. To date tax revenues are up 12.9% on top of last year's 14.6% total increase. Meanwhile, the deficit is decreasing and on the right path to meet the President's goal early.
Additional U.S. Economic Strength Indicators:
- More than 5.3 million new jobs created since the President's tax relief took effect.
- 5.3% economic (real GDP) growth for first quarter 2006 – fastest rate since 2003 – fastest of any major industrialized nation.
- 4% average real GDP growth since mid-2003.
- 12 straight quarters of business investment growth occurring immediately after May 2003, averaging 9%.
- 4.6% unemployment rate – lower than the average of the 60's, 70's, 80's or 90's.
Chart Description: Chart that shows current status of tax revenues and the federal deficit. A red line from left to right shows that tax revenues have been increasing since Jan. 2004. Blue bars graph the federal deficit, which has been on a decreasing trend.
REPORTS
Use featured image
Off