Eric Van Nostrand, P.D.O. Assistant Secretary for Economic Policy
Laura Feiveson, Deputy Assistant Secretary for Microeconomics
Tara Sinclair, Deputy Assistant Secretary for Macroeconomics
The U.S. economy has made considerable progress in 2023. Inflation is down six percentage points from its peak in 2022. At the same time, real wages are rising and unemployment remains historically low. But despite the significant progress on inflation, Americans continue to feel the pain of higher prices. President Biden’s economic agenda focuses on giving middle class families more breathing room. That means helping reduce the cost of goods and services, and even more importantly, increasing household incomes. When incomes rise faster than prices, households can afford more: they have more purchasing power. This is precisely the trend we have seen in the United States since the pandemic. Thanks to rising real wages (wages adjusted for inflation) and rising employment, the typical American can afford more goods and services than before the pandemic.
This blog explores the interplay of wages, employment, and prices to unpack this dynamic. We offer four key conclusions:
- Real wages have risen since before the pandemic across the income distribution. In particular, middle-income and lower-income households have seen their real earnings rise especially fast. And in the past 12 months, real wages overall have grown faster than they did in the pre-pandemic expansion.
- Household purchasing power has increased as a result. In 2023, the median American worker can afford the same goods and services as they did in 2019, plus an additional $1,000 to spend or save—because median earnings rose faster than prices.
- The U.S. economy now has over 2 million more jobs than pre-pandemic forecasters expected. Therefore, more and more workers are benefitting from increased purchasing power, thanks to the strong and resilient labor market.[1]
- This pattern of rising purchasing power is particularly American: other advanced economies have generally seen lower, and in many cases negative, real wage growth.
Real Wages Across the Income Distribution
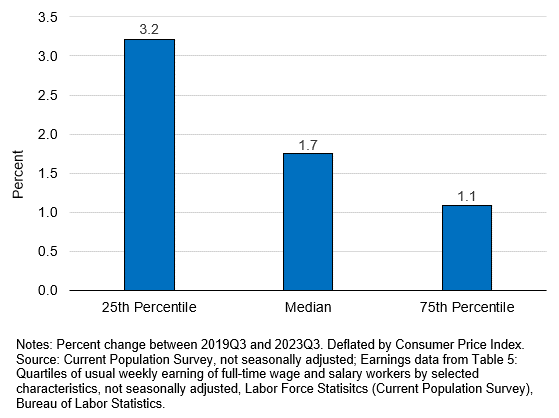
Biden-Harris policies over the past three years have contributed to strong wage growth—wage growth that has outpaced inflation. Support for labor unions and strong economic growth have served to create an economy that has strengthened workers’ voices.[2] Workers have capitalized on the environment created by these policies, successfully bargaining for higher wages. As a result, earnings have outpaced increases in prices such that real wages have increased since before the pandemic. Real weekly earnings for the median worker grew 1.7 percent between 2019 and 2023.[3] This means that one week of pay for the median worker now buys more than a week of pay did in 2019, despite higher prices. Furthermore, as shown in Figure 1, the increases in earnings are by no means concentrated at the top: in fact, they skew toward the middle class and the lower end of the income distribution. The 25th percentile of the wage distribution saw their nominal weekly earnings grow by $143, from $611 in 2019 to $754 in 2023. When adjusted for inflation, this amounts to a 3.2 percent increase in real earnings. Real earnings increases were particularly strong for the median Black and Hispanic Americans, who saw increases of 5.7 and 2.9 percent, respectively.[4]
Figure 1: Growth of Real Earnings since Pre-Pandemic Across Income Distribution
Not only is the level of real earnings higher than before the pandemic, but, as shown in Figure 2, the growth of real wages was faster over the past 12 months than it was during the pre-pandemic expansion, especially for production and non-supervisory workers. Continued robust growth in real wages sets the stage for further gains in purchasing power.
Figure 2: Real Wage Growth, Last 12 Months vs. Pre-Pandemic

Rising Purchasing Power for the Median American Worker
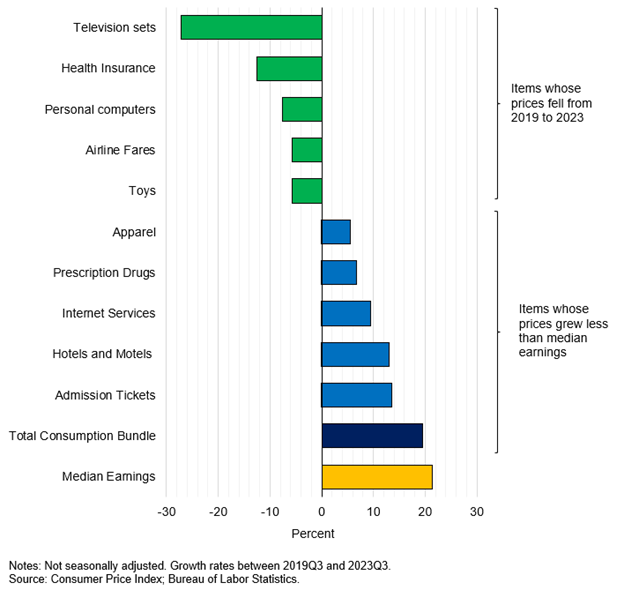
The typical "consumption bundle" purchased by the average American reflects a mixture of goods and services that have seen different price changes since 2019: increases for some items and declines for others. Americans are certainly feeling the bite of higher gas and food prices, which were hit hard by Russia’s brutal war in Ukraine. Since gas and food are purchased frequently and are necessities, they are particularly salient to consumers. But the prices of many other goods and services have increased by less than median earnings or have outright declined. These include more infrequent or less salient purchases such as televisions, airline fares, internet services, and health insurance. On net, the price growth of the average consumption bundle—which includes all items typically purchased and is shown in dark blue in Figure 3—has been less than the growth of median earnings.
Figure 3: Examples of Goods and Services with Muted Price Growth or Price Declines from 2019 to 2023
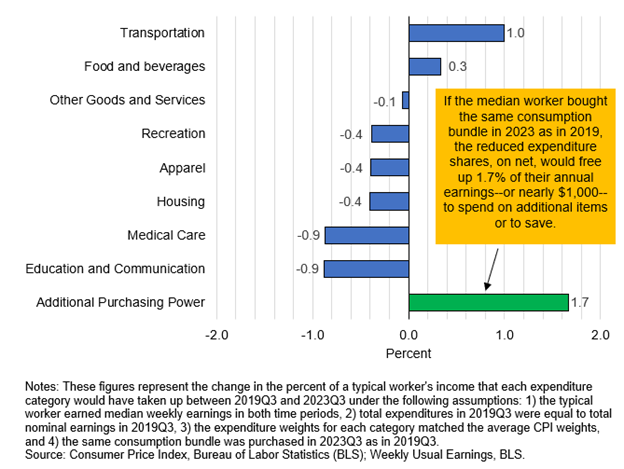
Overall, these data show that most American workers can afford more goods and services than they did before the pandemic. To illustrate this, we consider a worker that made median weekly earnings in both 2019 and 2023. We suppose that, in 2019, this worker used their annual income to buy a consumption bundle according to the expenditure shares of the average American household.[5] We then project what their expenditures would have been to buy the same bundle in 2023.[6] Figure 4 shows how the share of earnings for each major expenditure category changed between 2019 and 2023. Although for two of the expenditure categories—transportation, and food and beverages—the percent of earnings increased, for all other major categories it decreased. On net, expenditures on the consumption bundle would have decreased as a percent of annual earnings by 1.7 percent. Since median annualized earnings in 2023 were $58,140, the median worker would have had an additional nearly $1000 dollars to spend or save in 2023 had they bought the same goods and services they had in 2019.
Figure 4: Expenditure Share of Median Earnings, Change from 2019 to 2023
Employment Growth Beating Forecasts
As shown above, purchasing power has risen for workers that were employed in 2019 and remain employed in 2023. But this observation alone understates the improvement in purchasing power for American households: not only are workers making higher earnings, but there are more workers than forecasters had predicted before or during the pandemic in 2020. In fact, the prime-age employment-to-population ratio has recently reached an over 20-year high, a sign of the labor market’s strength. Higher levels of employment mean more workers and households are experiencing and sharing in the strength of real wages.
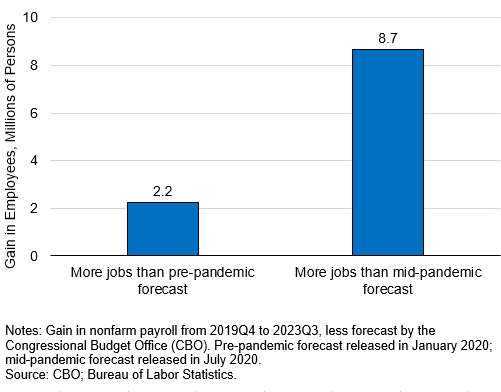
In Figure 5, we compare today’s labor market outcomes with what the Congressional Budget Office (CBO) expected to occur in 2020. The first bar shows that employment for the third quarter of 2023 surpassed their pre-pandemic forecast by more than 2 million jobs, suggesting that the labor market is even stronger than had been expected before the pandemic. And, of course, forecasts were much more dire in the summer of 2020 after the onset of the pandemic. At that time, CBO expected that by the third quarter of 2023, there would be 8.7 million fewer jobs than there are today (second bar). Had either of those earlier forecasts come true, those millions of left-out workers would not be sharing in any current wage gains, and their purchasing power would likely have been lower as their families and households would have faced tighter budgets without their labor earnings.
Figure 5: Employment—Actual versus Forecasted
Real Wage Growth in Global Context
This marked increase in purchasing power seems to be specific to the United States. Other advanced economies, which have also experienced elevated rates of inflation, have largely seen declines in purchasing power since the pandemic.[7] Of course, these countries all face different challenges. Some of these differentials are due to European economies being more exposed to Russia’s war in Ukraine, which raised food and energy prices substantially. Still, the United States stands out for the improvement in the purchasing power of American workers. Figure 6 shows the increase in average real earnings across countries from 2019 to 2023. Note that, for data availability and comparability reasons, we show average hourly earnings for production and non-supervisory workers in the United States rather than real median weekly earnings referenced in some of the figures above.[8]
Figure 6: International Comparison of Real Wage Growth 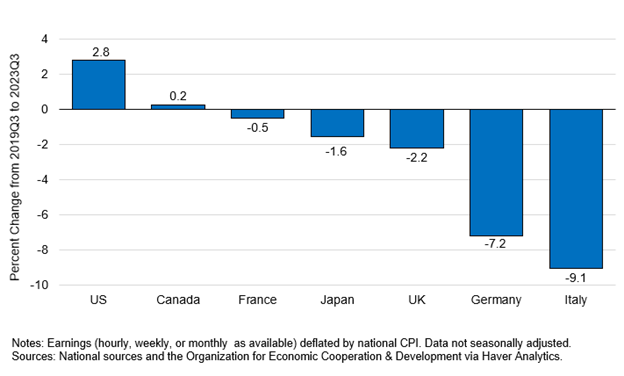
Conclusion
The well-being of American households depends critically on their purchasing power. Inflation eats into purchasing power, and many Americans have felt the bite of higher prices in their budgets in this recovery. But at the same time, higher wages and increased employment have outweighed the negative from inflation, and overall purchasing power has increased for most households. The policies of this Administration have prioritized the well-being of American workers and their families—and these policies have worked. A stronger labor market has meant more bargaining power for workers, new and better jobs for workers to move into, and strong wages for millions more Americans.
[1] To quantify the added purchasing power from employment gains, we need a measure of labor income at the household level. Household income is available from Census at an annual frequency, currently through 2022. However, the 2019 value of household income was likely a nonrepresentative sample—the data were collected at the peak of the pandemic between February and April of 2020. See Rothbaum, Jonathan. “Was Household Income the Highest Ever in 2019?” U.S. Census Bureau, September 15, 2020. As compared to 2018, real median household income grew 2.1 percent through 2022, but this confounds growth during the pandemic and recovery with growth between 2018 and 2019. For this reason, we focus in this piece on the median earnings of American workers and on employment separately.
[2] See U.S. Department of the Treasury. “Labor Unions and the Middle Class.” August 28, 2023.
[3] Throughout this piece, comparisons between 2019 and 2023 represent comparisons between the third quarter of 2019 and the third quarter of 2023 to account for seasonal patterns in the data. This particular statistic uses real median usual weekly earnings of full-time wage and salary workers, not seasonally adjusted. Although this statistic has a seasonally adjusted published value, for which the growth rate from 2019Q3 to 2023Q3 is 1.4 percent, we report the NSA statistic to be consistent with the other estimates in Figure 1 which are only available not seasonally adjusted.
[4] For a more detailed review of the progress made by historically disadvantaged groups in the recovery from the pandemic, see U.S. Department of the Treasury. “Equitable Recovery in the United States.” October 23, 2023.
[5] We used the relative importance of major expenditure categories for the CPI-U in the third quarter of 2019 to estimate expenditure weights.
[6] The projection is based on the cost of each major expenditure category growing in line with its CPI price index from the third quarter of 2019 to the third quarter of 2023.
[7] On the comparison of inflation experiences across countries, see Van Nostrand, Eric, and Tara Sinclair. “The U.S. Economy in Global Context.” U.S. Department of the Treasury, October 26, 2023.
[8] The earnings series used for each country is: United States: Average Hourly Earnings, Production & Non-Supervisory Employees: Private Nonfarm; Canada: Average Hourly Earnings including Overtime: Hourly Workers: Total Economy; France: Hourly Wages: Total Industry excluding Construction; Japan: Average Monthly Earnings (30 or more employees): All Industries; Great Britain (UK): Average Weekly Earnings (incl Bonus): Manufacturing; Germany: Negotiated Hourly Earnings: Industry including Construction; Italy: Contractual Wages per Hour: Industry including Construction.
