
1. Introduction
Prospects for the American economy looked grim at the beginning of 2021. The shock of the pandemic and ensuing lockdowns seemed too great for the economy to bear without lasting detrimental effects. Professional forecasters expected the unemployment rate to remain well above 5 percent for the next year. Real GDP by the end of 2021 was expected to be more than 3.5 percent below its pre-pandemic trend.[1]
Had these pessimistic forecasts been realized, Black and Hispanic households would likely have experienced a disproportionate amount of the economic pain. During economic downturns, Black and Hispanic Americans have historically faced unemployment rate increases that are larger than those faced by other groups. Had the overall unemployment rate been 5.5 percent at the end of 2021 as forecasted, historical trends suggest that the Black and Hispanic unemployment rates would have then been 9.6 and 7.0 percent, respectively.
But that pessimism was proven wrong—both for the aggregate economy and especially for those households too often left behind. The unemployment rates for Black and Hispanic workers dropped to 7.0 and 4.8 percent by the end of 2021. Other measures of financial well-being for those workers, on average, remained either relatively strong or improved, such as low delinquency rates and increasing household wealth. In fact, according to last week’s release of the Survey of Consumer Finances (SCF), median wealth, adjusted for inflation, increased between 2019 and 2022 by 60 and 47 percent for Black and Hispanic families, some of the largest increases in the survey’s history. Racial wealth gaps narrowed between 2019 and 2022.[2] While we focus only on Black and Hispanic households in this report for data availability reasons, the strong recovery appears to have extended to other minority groups and more narrow subgroups. According to the evidence from household finance and labor markets we describe in this report, this recovery was the most equitable in recent history.
Why was this recovery so equitable? The strength and speed of the overall recovery is one important factor. The actions taken and investments made by the Biden-Harris Administration, state and local governments, and the Federal Reserve—as well as the rapid pace of vaccine development and dissemination—helped thwart the worst economic outcomes anticipated from the COVID shock. By the end of 2021, the overall unemployment rate was below 4 percent, and real GDP had nearly returned to its pre-pandemic trend. The strong and speedy recovery was particularly important for Black and Hispanic Americans, who have been historically most vulnerable to economic cycles and were hardest hit by the COVID downturn.
The second factor is the specific design of Biden-Harris Administration policies, such as Economic Impact Payments, Emergency Rental Assistance, and the expanded child tax credit, all of which focused on avoiding the worst outcomes for the most financially vulnerable groups. Measures of income, entrepreneurship, poverty, child poverty, business ownership, and housing stability reflect the success of these policies: the financial health of Black and Hispanic households has outperformed past recoveries and, according to some measures, has actually improved relative to the pre-pandemic period. For example, the rates of business ownership for Black and Hispanic families rose by 6.2 and 2.8 percentage points, respectively, to their highest rates in history.
These gains are particularly notable given what could have happened had there been a more severe and inequitable recession. But there is still more to do. The ratios of wealth holdings between the typical Black and white families and between the typical Hispanic and white families are just 16 and 22 percent, respectively, despite increases in these measures over the past three years.[3] The Biden-Harris Administration is committed to capitalizing on the improvements made in this recovery to continue to make progress on equity going forward.
Pursuing equitable outcomes is a key goal of Biden-Harris policymaking and of the strategy Secretary Yellen calls “modern supply-side economics.” By promoting equity and inclusion, Biden-Harris policies unlock the potential of even the most disadvantaged households. Ultimately, this helps all Americans by boosting total productivity, labor force participation, innovation, and economy-wide resilience.
In this report, we explain why a strong recovery is so critical for our communities of color (Section II), how the design of the Biden-Harris policies was uniquely beneficial for these groups (Section III), and why having the most equitable recovery in recent history is good for all Americans (Section IV).
2. A Fast Overall Recovery Helped Communities of Color
The COVID pandemic marked a time of unprecedented change in the economy. As the economy shut down in the second quarter of 2020, economic output as measured by real GDP fell 28 percent at an annual rate—the largest quarterly drop in history. Despite the fiscal and monetary policy enacted in 2020, real GDP fell by 1 percent over the four quarters of 2020.
With a shock to the economy that large, the risk of a prolonged recession was high. Outside forecasters in the beginning of 2021 expected real GDP to grow tepidly, remaining at more than 3.5 percent below trend at the end of 2021. Thanks to the American Rescue Plan (ARP) and other Federal and state actions, this did not happen. Instead, as shown in Figure 1, real GDP rebounded quickly, nearly reaching its pre-pandemic trend level by the end of 2021. The labor market also rebounded. By the end of 2021, the unemployment rate was under 4 percent—more than 1.5 percentage points lower than what had been expected in January 2021.
Figure 1: Actual versus Forecasted GDP
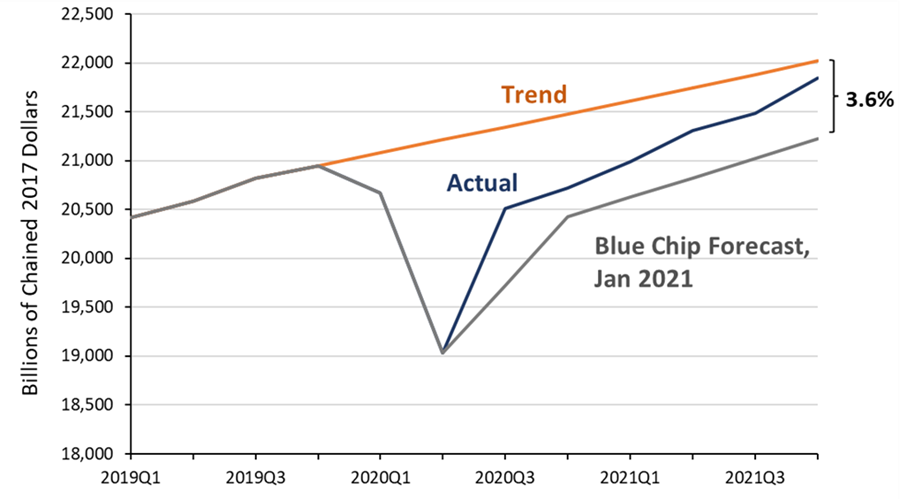
Note: Quarterly path of Blue Chip Forecast is backed out from the forecasts for 2020Q4/Q4 and 2021Q4/Q4 growth rates.
Source: Blue Chip Indicators for January 2021.; U.S. Bureau of Economic Analysis. 2023. Real Gross Domestic Product (GDPC1). FRED, Federal Reserve Bank of St. Louis. Last accessed October 19, 2023.
A recession as predicted by those forecasts would have been disproportionately felt by households and workers of color. A 1 percentage point change in the national unemployment rate is typically accompanied by 1.6 and 1.4 percentage point increases in the unemployment rates for Black and Hispanic workers, respectively.[4]
Job losses that occur during a recession tend to have long-lasting effects. Even though disadvantaged workers experience greater improvements in employment outcomes during expansions, the benefits of expansions do not outweigh the costs of recessions.[5] One study finds that an exposure to a 1 percentage point larger local unemployment rate increase during the Great Recession led to reduced employment rates by 0.3 percentage points years later in 2015, suggesting substantial employment hysteresis.[6] Generally, the scarring effects of recessions are well documented, with earnings losses lingering for years after a recovery and with the worst outcomes felt by the lowest income and least educated workers.[7]
All in all, the extraordinary policy actions taken to reduce the length and magnitude of the COVID recession had important and long-lasting effects on all Americans, but particularly those that fare the worst during economic downturns. Had the unemployment rate at the end of 2021 been 1.5 percentage points higher than it was, as predicted in January 2021, Black unemployment would have been 9.6 percent and Hispanic unemployment would have been 7.0 percent. Instead, they were 7.0 and 4.8 percent, respectively. These differences mean that an additional 530,000 Black Americans and 670,000 Hispanic Americans were employed at the end of 2021 beyond what had been forecasted, totaling more than one million workers that did not have to face the scars of long-term unemployment.
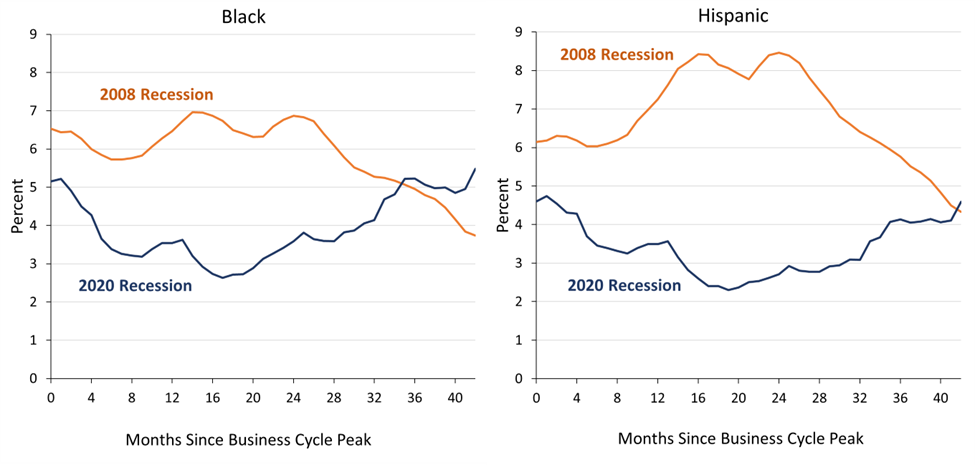
Figure 2 shows the change in unemployment rates for Black Americans (left panel) and Hispanic Americans (right panel) compared to previous recessions. Within 20 months after the COVID recession peak, both unemployment rates were lower than they were at the same time in previous recoveries and have stayed lower through the most recent data.
Figure 2. Black and Hispanic Unemployment Rate Paths, Comparisons Across Recessions
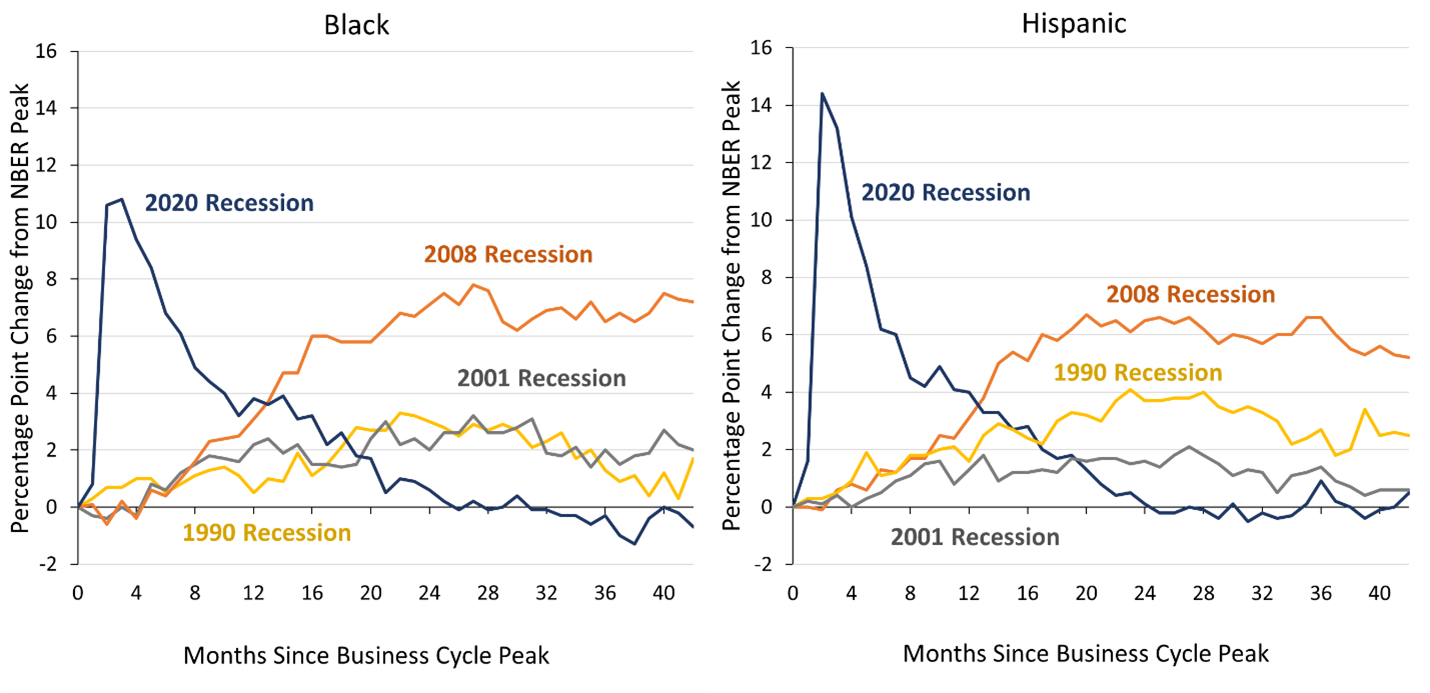
Notes: Figure shows the seasonally adjusted unemployment rate for Black individuals ages 16 and over (including those of Hispanic origin) and for Hispanic individuals ages 16 and over (of any race) relative to the previous business cycle peak month, as dated by the National Bureau of Economic Research (NBER). The peak months were July 1990 for the 1990 recession, March 2001 for the 2001 recession, December 2007 for the 2008 recession, and February 2020 for the 2020 recession.
Source: U.S. Bureau of Labor Statistics. n.d. (Seas) Unemployment Rate: Black or African (LNS14000006), and Hispanic or Latino (LNS14000009). Current Population Survey. Last accessed October 3, 2023.
Figure 3 shows the differences between Black and white and Hispanic and white unemployment rates. Although both the Black and Hispanic unemployment rates remain higher than the white unemployment rate, the gaps have closed substantially, and both measures dropped near to their historic lows in 2023. Also notable is the speed of the relative recovery—in 2021, the Black and Hispanic unemployment rates fell rapidly relative to the white unemployment rate, as seen in the sharp drop of both measures in Figure 3. In contrast, both Black and Hispanic unemployment rates remained elevated relative to the white unemployment rate for the years following previous recessions.
Figure 3. Black and Hispanic Unemployment Rates Relative to White Unemployment Rate
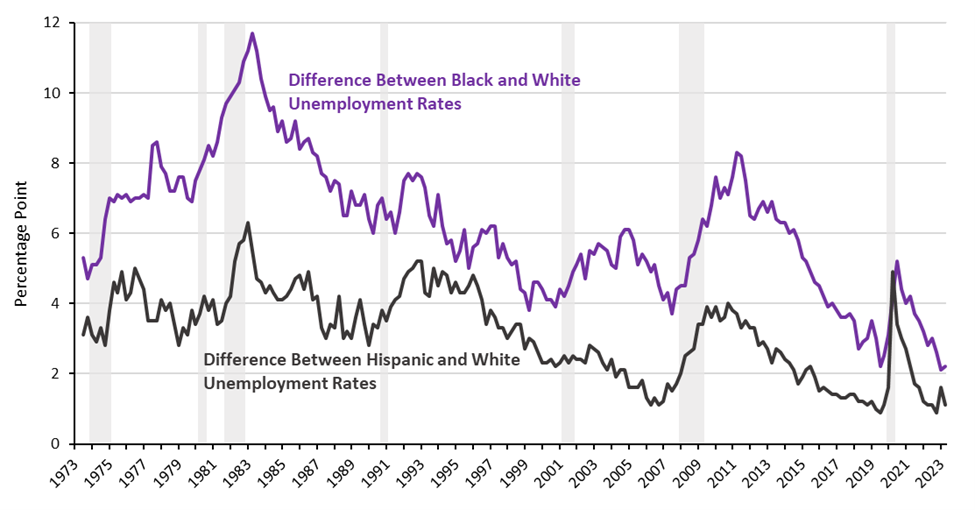
Notes: Figure shows the seasonally adjusted unemployment rates for Black individuals ages 16 and over (including those of Hispanic origin) and for Hispanic individuals ages 16 and over (of any race) relative to the seasonally adjusted unemployment rate for white individuals ages 16 and over (including those of Hispanic origin). Unemployment data series shown starts in March 1973 and ends in August 2023. The shaded areas represent U.S. recessions as determined by the NBER.
Source: U.S. Bureau of Labor Statistics. n.d. (Seas) Unemployment Rate: Black or African (LNS14000006Q), Hispanic or Latino (LNS14000009Q), and White (LNS14000003Q). Current Population Survey. Last accessed October 4, 2023.
Employment-population ratios, shown in Figure 4, tell a similar story, recovering much more quickly for Black and Hispanic populations in this recovery than in the previous three. In fact, in the aftermath of the Great Recession, the Black employment-population ratios were still falling more than three years after the business cycle peak.
Figure 4. Black and Hispanic Employment-Population Ratios, Comparison Across Recessions
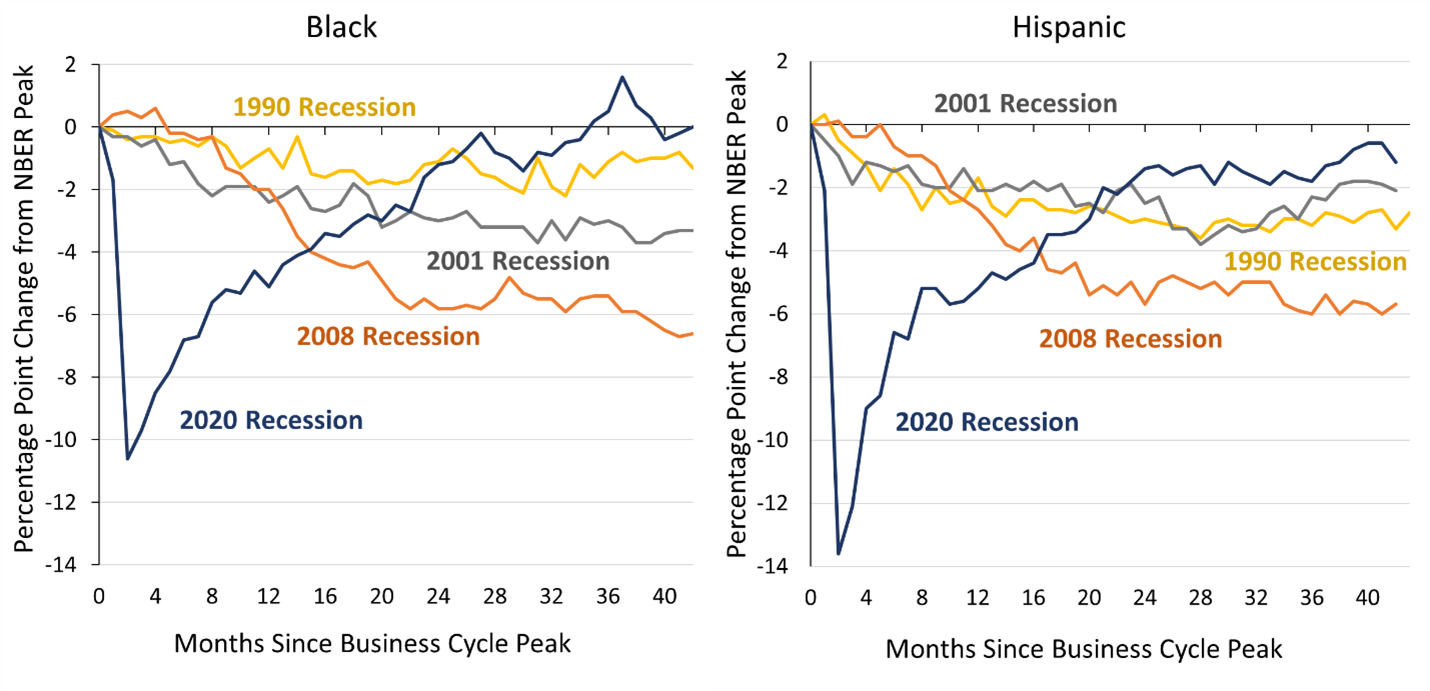
Notes: Figure shows the seasonally adjusted employment-population ratios for Black individuals ages 16 and over (including those of Hispanic origin) and for Hispanic individuals ages 16 and over (of any race) relative to the previous business cycle peak month, as dated by the NBER. The peak months were July 1990 for the 1990 recession, March 2001 for the 2001 recession, December 2007 for the 2008 recession, and February 2020 for the 2020 recession.
Source: U.S. Bureau of Labor Statistics. n.d. (Seas) Employment-Population Ratio: Black or African (LNS12300006), and Hispanic or Latino (LNS12300009). Current Population Survey. Last accessed October 4, 2023.
Despite the high rate of inflation during the pandemic and recovery, wage growth outpaced consumer price growth, so real wages and earnings rose for most full-time workers. Median real earnings for full-time workers rose for all races from 2019 through 2022, with extra sharp increases for Black and Hispanic workers. During the COVID recession and recovery, the three-year growth rate of real earnings was 4.0 percent for Black workers, 2.4 percent for Hispanic workers, and 0.3 percent for white workers. The significant gains for Black and Hispanic workers contrast with outcomes following the Great Recession, where these workers experienced more muted gains over the three years following the business cycle peak.
Figure 5. Three-Year Growth Rates of Real Wages for Full-Time Workers by Race and Hispanic Origin
Notes: Growth rates for each recession are constructed as follows: 3-year growth over 2000 to 2003 for the 2001 recession, growth over 2007 to 2010 for the 2008 recession, and growth over 2019 to 2022 for the 2020 recession. (Data not available prior to 2000.)
Source: U.S. Bureau of Labor Statistics. 2023. Employed full time: Median usual weekly real earnings: Wage and salary workers: 16 years and over: Black or African American (LEU0252884600Q), Hispanic or Latino (LEU0252885500Q), and White (LEU0252883700Q). FRED, Federal Reserve Bank of St. Louis. Last accessed October 19, 2023.
Overall, improvements in labor market outcomes for Black and Hispanic workers were particularly pronounced in the years following the COVID recession relative to both white workers and to previous recoveries.
3. Targeted American Rescue Plan Policies Made the Recovery Even More Equitable
The previous section reviewed the rapid recovery of the labor market for Black and Hispanic workers. But labor market outcomes are only one piece of financial health, and other measures of financial well-being depended greatly on the institutional details and design of Federal policy. In this section, we review how the specific policies in the ARP helped the most financially vulnerable in the economy. We also present data that suggests these policies were successful at supporting a recovery that was equitable across race and Hispanic origin according to a broad array of financial indicators.
Household Balance Sheet Support
In 2021, more than $500 billion were transferred directly to households in the form of Economic Impact Payments (EIPs).[8] In the third, and largest, round of the EIPs (which were a part of the ARP) a qualifying household of four received $5,600, or 63 percent of monthly income for a median household.[9] Because the EIPs were phased out for higher income levels, the transfers were targeted to the bottom half of the income distribution. Due to the EIPs and other Federal, state, and local transfers—like extended unemployment insurance—and additional factors—such as reduced spending in the height of the pandemic—balance sheets remained strong throughout the pandemic, contributing to a speedy and resilient recovery.[10]
Examining changes in total household wealth during the COVID recession and recovery compared to previous recessions and recoveries can provide insight into how these transfers affected the balance sheets of Black and Hispanic families. Data from the newly published SCF shows that median wealth, when adjusted for prices, grew 37 percent, which was the largest increase in the history of the SCF. Furthermore, as shown in Figure 6, median wealth rose more in percentage terms for Black and Hispanic families than for white families. Specifically, wealth increased by 60 and 47 percent for the median Black and Hispanic families, respectively, compared to 31 percent for the median white family. Their gains were much larger than they experienced over the two previous recessions.[11]
Figure 6. Changes to Median Wealth over Recessions and Recoveries by Race and Hispanic Origin
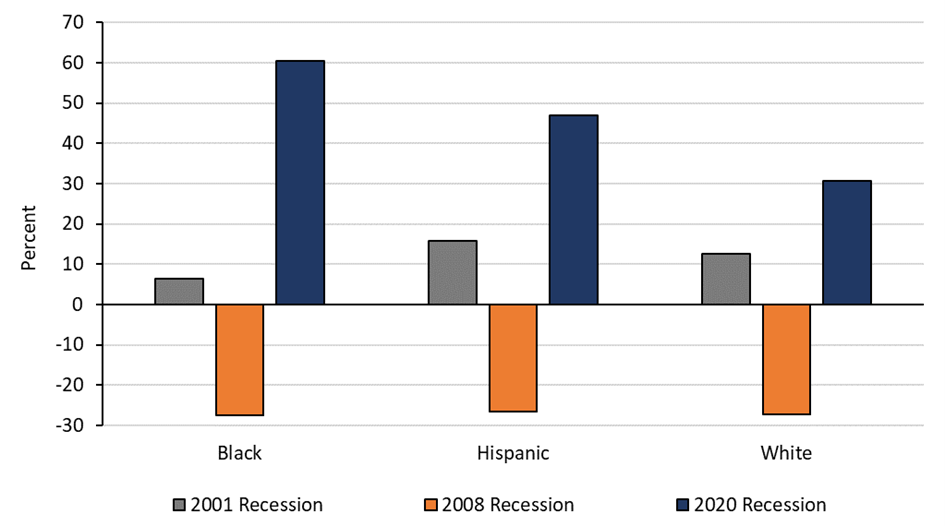
Note: Median wealth is adjusted for inflation. Growth rates were calculated as 3-year average growth over 1998 to 2004 for the 2001 recession, growth over 2007 to 2010 for the 2008 recession, and growth over 2019 to 2022 for the 2020 recession.
Source: Board of Governors of the Federal Reserve Board. 2023. Table 4 – Family Net Worth, by Selected Characteristics of Families, 1989-2022 Surveys. Survey of Consumer Finances. Last accessed October 19, 2023.
Two facts can explain the higher percentage increase for Black and Hispanic families in the COVID recovery. First, the base amount of wealth held by Black and Hispanic families is much lower than that of white families. In 2019, the median Black and Hispanic families had $28,000 and $42,000 in household net worth, respectively. The median white family had $218,000, more than five times those amounts. Since Black and Hispanic families have much lower bases of wealth, the same dollar transfer to them would increase their wealth by a greater percentage. Second, on average, Black and Hispanic families both have lower incomes than white families and, thus, likely received more of the transfers.
Delinquency rates for credit cards over the recession and recovery provide another window into the strength of household balance sheets. To look at these, we use the Equifax data on delinquencies by address of account holder, aggregated at the zip-code level. These data go back to 2005, spanning both the Great Recession and recovery and the COVID recession and recovery.[12] In Figure 7, we group the accounts in majority-Black and majority-Hispanic Zip Code Tabulation Areas (ZCTAs) and show that the percentage of balances that were severely delinquent in each of those groupings was very different between the two recessions. For majority-Hispanic ZCTAs in the Great Recession, delinquency rates rose for two years, whereas in the COVID recession, the delinquency rates started lower and then fell for more than a year and a half. For majority-Black ZCTAs in the Great Recession, delinquency rates remained relatively high, particularly throughout 2009. In contrast, delinquency rates in majority-Black ZCTAs fell significantly through the first two years of the COVID recovery. While the low delinquency rates for both groups in 2021 were at least partially due to the overall strength of the recovery, the fact that they decreased relative to 2019 was likely due in part to the government transfers received by the most financially fragile households.[13]
Figure 7: Black and Hispanic Severe Delinquency Rates in Bank Cards and Retail Credit Cards Relative to Business Cycle Peak
Notes: Severely delinquent balances are those 60 days or more past due or in collections. The graphed data represent groups of Zip Code Tabulation Areas (ZCTAs), not individuals. Thus, changes in balances on severely delinquent accounts are partially driven by all ethnic and racial groups within the ZCTA group. Majority Black ZCTAs are those with >50 percent Black alone, non-Hispanic population. Majority Hispanic ZCTAs are those with >50 percent Hispanic population. ZCTA groups for the 2008 recession are defined by the ethnic and racial makeup as of the 2010 Decennial Census. ZCTA groups for the 2020 recession are defined by the ethnic and racial makeup as of the 2020 Decennial Census. The business cycle peak months, as dated by the NBER, were December 2007 for the 2008 recession and February 2020 for the 2020 recession.
Sources: Equifax Information Services LLC; 2010 and 2020 Decennial Census data.
Housing Support
Housing security is an important feature of economic stability and, for many families, at risk of deteriorating during a recession. For example, during the Great Recession, both evictions and foreclosures peaked, and housing wealth steeply declined.[14] To support housing stability, the Biden-Harris Administration implemented two programs through Treasury: the Emergency Rental Assistance (ERA) program, which provided over $46 billion to support renters, and the Homeowner Assistance Fund (HAF), which made $10 billion available to support homeowners.[15]
Both programs focused on reaching households most in need of assistance. In the case of ERA, mitigating evictions disproportionately impacts the well-being of Black households since Black renters typically experience a disproportionate share of eviction filings. While Black individuals make up 20 percent of all adult renters in the counties for which data are tracked by the Eviction Lab, they account for nearly 33 percent of all eviction filing defendants. Black and Hispanic women were more likely to be evicted than their male counterparts, and there is evidence that Black and Hispanic renters who were filed against for eviction were more likely than any other group to be repeatedly filed against at the same address.[16]
The data confirm that ERA funds did go to communities with higher shares of Black or Hispanic renters. ERA dollars received per renting household were higher in census tracts with larger shares of Black or Hispanic renters. On average, a renting household in a census tract that’s renting population was 75 percent Black or Hispanic received over $375 more than a census tract that has a renting population that is 25 percent Black or Hispanic (Figure 8). In addition, more ERA dollars went to neighborhoods with higher shares of residents in poverty and renting households headed by single mothers.[17] Furthermore, a study by the GSA Office of Evaluation Sciences found that Black renters received support from the ERA at a higher proportion than their overall representation among eligible renters.[18]
Figure 8. ERA Funds Per Renting Household by Deciles of Black or Hispanic Share of Renting Households

Notes: Each dot represents one decile of renting households. The dashed line represents the average funds per renter household of about $650. The data are limited to census tracts with at least one renting household. Data are from the U.S. Department of the Treasury and the U.S. Census Bureau.
Source: Figinski, Theodore F., Richard Sweeney, and Erin Troland. 2023. “Targeted Relief: Geography and Timing of Emergency Rental Assistance Funds.” Unpublished manuscript.
Homeowners, in addition to renters, faced significant hardship during the COVID-19 pandemic, particularly Black and Hispanic households who were already disadvantaged with homeownership rates of 44.0 and 48.1 percent, respectively, compared to 73.7 percent of white households leading into 2020.[19] To address the potential for a wave of foreclosures among disadvantaged homeowners, Treasury’s HAF program provided nearly $10 billion to assist them with mortgage payments, homeowner’s insurance, and utility payments.[20]
Thanks in part to HAF and other housing support policies, foreclosure rates during the pandemic remained low relative to prior economic downturns, especially the Great Recession (see Figure 9). The quarterly foreclosure rates for Black and Hispanic households in 2020Q4 were 0.05 and 0.03 percent, respectively, the lowest rates for both groups since 1992Q1, the first quarter in which the data are available. Although data on foreclosures by race and Hispanic origin are unavailable past 2020, the aggregate foreclosure rate has remained low since then,[21] suggesting that foreclosures for each group have also likely remained low. This is in stark contrast to the experience in the Great Recession when the Black and Hispanic foreclosure rates rose to 1.1 and 2.4 percent, respectively, which are more than 20 and 80 times the 2020 rates.
Figure 9. Quarterly Foreclosure Rate by Race and Hispanic Origin

Note: Figure plots the quarterly foreclosure rate through 2020Q4 by race and ethnicity from a sample of homeowners with observed purchase prices in the Home Mortgage Disclosure Act data.
Source: Data provided by Amir Kermani. For a detailed description of the data, see Kermani, Amir, and Francis Wong. 2021. “Racial Disparities in Housing Returns.” NBER, working paper no. 29306.
Despite the widespread hardship caused by the pandemic, homeownership rates for every racial group increased since 2019 (see Figure 10). Between 2019 and 2022, Black, Hispanic, and white homeownership rates rose 2.9, 1.2, and 1.1 percentage points, respectively. This occurred despite aggressive interest rate increases, which significantly raised the cost of borrowing beginning in early 2022. In contrast, homeownership rates fell over the Great Recession and rose by less for Black and Hispanic households in the 2001 recession and recovery.
Figure 10. Three-Year Change in Homeownership Rates by Race and Hispanic Origin
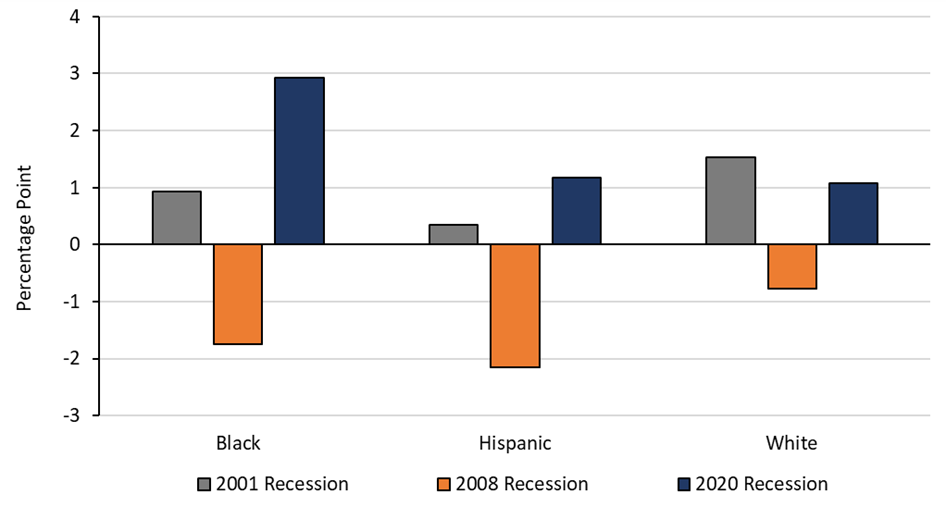
Notes: Figure displays the proportion of all households that are homeowners. Hispanic includes anyone of Hispanic ethnicity regardless of race. Changes in homeownership rates for each recession are constructed as follows: changes from 2000 to 2003 for the 2001 recession, 2007 to 2010 for the 2008 recession, and 2019 to 2022 for the 2020 recession.
Source: U.S. Census Bureau. 2023. Homeownership Rates by Race and Ethnicity: Black Alone (BOAAAHORUSQ156N), Hispanic (of Any Race) (HOLHORUSQ156N), and Non-Hispanic White Alone (NHWAHORUSQ156N). FRED, Federal Reserve Bank of St. Louis. Last accessed October 19, 2023.
Poverty and Child Poverty
To prevent households, and particularly children, from experiencing hardship during the pandemic, the ARP expanded the child tax credit for the 2021 tax year, increasing the amount of relief received by eligible households from $2,000 to at least $3,000. The ARP also made the child tax credit fully refundable and allowed half to be paid out as monthly benefits for many taxpayers. In 2022, the child tax credit reverted to its previous level.
The child tax credit had a significant impact on poverty rates, as shown in Figure 11. Poverty rates for all racial and ethnic groups have been declining since the Great Recession and continued to decline in 2020 and 2021 despite hardship caused by the pandemic. In 2022, however, poverty rates for all groups increased closer to their 2019 levels due partly to the reversion of the child tax credit back to its pre-pandemic amount, along with the expiration of other recovery programs.[22]
Figure 11. Percentage of People in Poverty Using the Supplemental Poverty Measure by Race and Hispanic Origin

Notes: An expansion of the child tax credit was enacted in 2009 by the American Recovery and Reinvestment Act and made permanent by the Protecting Americans from Tax Hikes Act in 2015. The American Rescue Plan (ARP) Act included another expansion of the child tax credit, which was temporary and only in effect for the year 2021. Changes in methodology were implemented for surveys in the years 2013, 2017, and 2019, resulting in consecutive years no longer being comparable at each break.
Source: U.S. Census Bureau. 2023. Table B-2 – Number and Percentage of People in Poverty Using the Supplemental Poverty Measure by Age, Race, and Hispanic Origin: 2009 to 2022. Current Population Survey, 2010 to 2023 Annual Social and Economic Supplements (CPS ASEC). Last accessed October 19, 2023.
Women of color especially benefitted from the expansion of the child tax credit because, of the nearly 10 million single-parent households with a child under the age of 18, 48 percent are headed by single Black or Hispanic mothers.[23] The increased economic security provided by the expanded child tax credit is one factor that contributed to the increase in the female labor force participation rate during the COVID recovery. Another factor is the increase in workplace flexibility that occurred as businesses adapted to the pandemic. The prime-age labor force participation rates for women can be seen in Figure 12. In the most recent data, Black, white, and especially Hispanic women have joined the labor force at historically high rates. An analysis from Brookings finds that women between the ages of 25 and 54 whose youngest child is under the age of 5 have been driving the growth in female labor force participation since 2020.[24]
Figure 12. Labor Force Participation Rates for Women, Ages 25–54, by Race and Hispanic Origin
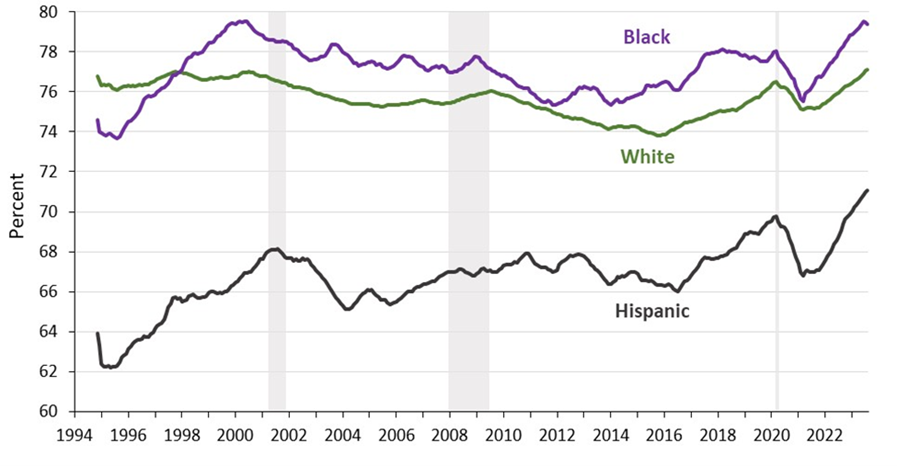
Note: Labor force participation rates shown are 12-month backward moving averages from November 1994 through August 2023.
Source: U.S. Bureau of Labor Statistics. n.d. (Unadj) Labor Force Participation Rate – 25–54 yrs.: Black or African American Women (LNU01300068), Hispanic or Latino Women (LNU01300071), and White Women (LNU01300065). Current Population Survey. Last accessed October 5, 2023.
Business and Entrepreneurship Support
Support for small businesses and entrepreneurship is another crucial way that the Biden-Harris Administration contributed to an equitable recovery. Biden-Harris policies that supported business growth during the pandemic recovery include the continuation of the Paycheck Protection Program (PPP), which provided small businesses with resources to maintain payroll, hire back laid off employees, and cover overhead, and the reauthorization and the expansion of the State Small Business Credit Initiative (SSBCI), which helps small business access capital needed to invest in job-creating opportunities.
Business dynamism and entrepreneurship are important for future growth and household financial well-being for households of all races. But business creation often suffers during economic downturns and can be slow to return to pre-downturn levels.[25] For example, monthly business applications declined nearly 24 percent from December 2007 to December 2008 due to the Great Recession and did not exceed its December 2007 value until 5 years later.[26]
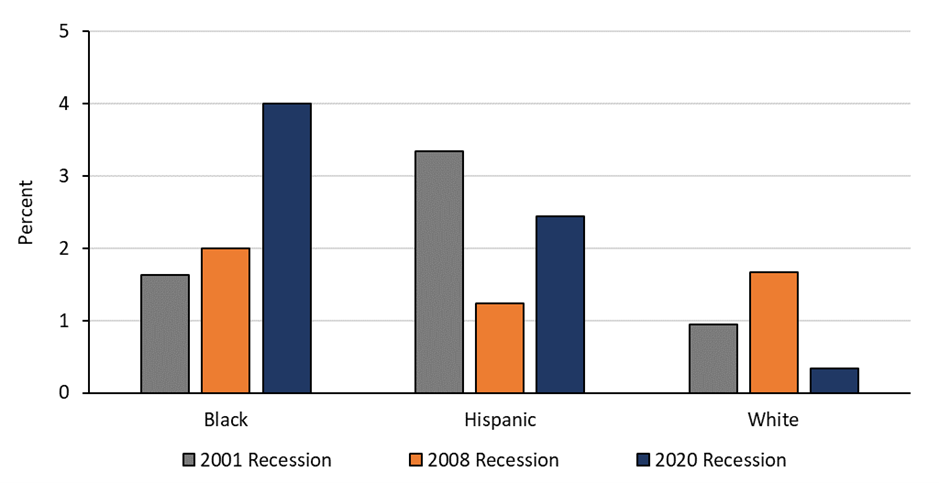
In contrast, business growth during the COVID-19 pandemic and subsequent recovery has been robust.[27] Black and Hispanic business owners are an important part of this surge in business dynamism.[28] Areas with a higher proportion of Hispanic and particularly Black residents saw relatively larger increases in application rates in 2021.[29] Corroborating this finding, there is evidence of disproportionate increases in entrepreneurship among minority business owners, as shown in Figure 13. The number of Black and Hispanic workers that were self-employed—albeit an imperfect proxy for business ownership—increased by 22 and 24 percent, respectively, from 2019 to 2022. This is a larger increase than seen for those groups in previous recessions, and a much larger change than the 0.5 percent decrease seen by white workers in the 2020 recession.
Figure 13. Three-Year Growth Rates of Self-Employed Workers by Race and Hispanic Origin
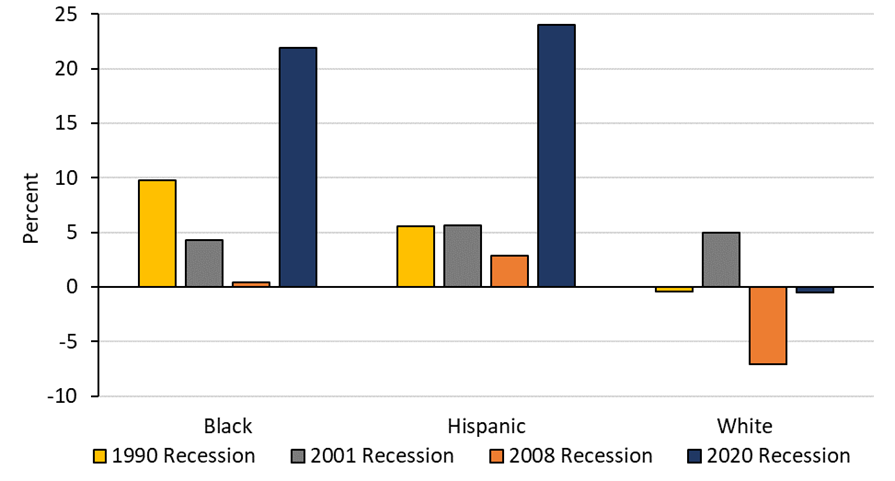
Note: The Black and white groups do not contain Hispanic individuals. The Hispanic group contains individuals of any race. Time periods used for 3-year comparisons (calendar year over calendar year) are as follows: 1990 recession – 1992 over 1989; 2001 recession – 2003 over 2000; 2008 recession – 2010 over 2007; and 2020 recession – 2022 over 2019.
Source: Treasury’s calculations using individual-level data from the Basic Monthly Current Population Survey released by the U.S. Bureau of Labor Statistics.
The newly published SCF gives a first reading into what has happened to business ownership by race and Hispanic origin in this recovery as compared to previous ones. Black and Hispanic rates of business ownership skyrocketed in this recession, rising between 2019 and 2022 by 6.2 and 2.8 percentage points to their highest recorded readings at 11.0 and 9.8 percent, respectively. These were the largest increases seen in the history of the SCF.
Figure 14. Changes in Business Ownership by Race and Hispanic Origin

Note: Difference in rates were calculated between 1989 and 1992 for the recession starting in 1990, three-year average difference between 1998 and 2004 for the 2001 recession, the difference between 2007 and 2010 for the 2008 recession, and the difference between 2019 and 2022 for the 2020 recession.
Source: Board of Governors of the Federal Reserve Board. 2023. Table 9 – (%s & Medians) Family Holdings of Nonfinancial Assets and of Any Asset, by Selected Characteristics of Families and Type of Asset, 1989-2022 Surveys. Survey of Consumer Finances. Last accessed October 19, 2023.
State and Local Government Support
The State and Local Fiscal Recovery Fund (SLFRF)—one of the largest components of the ARP—was behind all of the measures of financial health discussed above. The SLFRF directly provided $350 billion to state, local, territorial, and Tribal governments to support their response to and recovery from the pandemic. The funds have been used by the recipient governments to support a wide range of equity-promoting policies, including workforce support, childcare infrastructure, and affordable housing.
The broad reach of the SLFRF—both in geography and the scope of projects—suggests that a diverse set of Americans were touched by the funds. The funding formula for the allocations to metropolitan cities depended on measures of community need, so higher levels of per capita funds were directed to the most vulnerable members of the population. Virtually every state and local government in the country, more than 30,000 governments in all, received an SLFRF allocation. These funds allowed these governments to provide needed services to revitalize their economies and increase employment in their communities. The counterfactual of an alternative outcome is evident from the Great Recession when continued cuts to state and local government spending were a drag on economic growth for 14 consecutive quarters.
The far-reaching impact of the SLFRF is reflected in the uniformly strong labor markets across the country. All states but one are currently experiencing unemployment rates that are within 1 percentage point or below their pre-pandemic 2019 level of unemployment. Although state level unemployment rates by race are not available, local Black and Hispanic unemployment rates tend to improve when the associated local overall unemployment rate improves. In fact, the sensitivity of state-level unemployment rates for Black men and Hispanic men are, respectively, 2.0 and 1.6 times that of white men, such that Black and Hispanic workers tend to bear the brunt of local recessions and lagging recoveries.[30] Conversely, this means that Black and Hispanic workers have particularly benefited from this geographically broad-based recovery.
4. An Equitable Recovery is Good for All
Throughout this recovery, the Biden-Harris Administration, along with Secretary Yellen and Deputy Secretary Adeyemo, have prioritized policies that seek to support the well-being of the most disadvantaged households. This administration’s efforts delivered resources and aid effectively to underserved communities and enabled a quicker than expected and historically equitable recovery.
These policy responses acknowledge that equity is not only a worthy goal in of itself, but that improving equity is also good for the economy as a whole. The greatest current and future growth potential of the economy lies precisely with disadvantaged individuals and communities—this is the theory underlying what Secretary Yellen has called “modern supply-side economics.” Focusing on equity is not only justified for moral reasons, but serves all Americans by boosting total productivity, labor force participation, innovation, and economy-wide resilience.[31]
The full and fair engagement by people of color has been constrained for generations by historical and ongoing discrimination. Black and Hispanic children often attend racially segregated and economically under-resourced schools, and have less family wealth to support them through tutoring or enriching extracurricular activities.[32] Workers of color are discriminated against in hiring and promotion decisions[33] and are steered towards low-paying occupations that do not match their skills.[34] Black and Hispanic homeowners face bias in home appraisals, potentially constricting their abilities to get credit to invest in their businesses, homes, and children.[35] Racial wealth gaps are large and longstanding, which limit families’ abilities to invest in education, cover unexpected emergencies, purchase homes for stability and asset building, and launch new businesses.[36]
Policies designed to address these inequities increase economy-wide strength, benefitting all Americans now and in the future. Investments in children in disadvantaged communities can lead to stronger skill development and better workplace opportunities as adults.[37] Investments into housing affordability lead to more economic stability. Strengthening small business investment for underserved business owners could lead to greater innovation and raise employment.[38] And creating jobs in disadvantaged communities leads to higher productivity. One study indicates that boosting employment in disadvantaged regions results in at least 60 percent greater economic benefits than in booming regions.[39]
The pandemic-induced recession had the potential to lead to a generational downturn in the economy. Although government action was unable to avoid or remedy all of the economic challenges presented by the pandemic, the Biden-Harris Administration’s policy response led us to a rapid, robust, and equitable recovery. The broad-based nature of this recovery has led to a stronger and more resilient economy and will continue to have payoffs well into the future.
5. Conclusion
We have shown in this paper how Biden-Harris Administration policies have contributed to the most equitable recovery in recent history. Unemployment rates for Black and Hispanic individuals, who have historically fared the worst during economic downturns, recovered more quickly than in past recessions, and real earnings grew twice as much for these workers as they did in the three years following the onset of the Great Recession.
Along with these labor market gains, the policies of the Biden-Harris Administration contributed to significant increases in household wealth for Black and Hispanic Americans relative to prior downturns. The child tax credit increased labor participation among working mothers of color and reduced child poverty. And support for small businesses enabled entrepreneurs to start and grow their businesses. Black and Hispanic rates of business ownership skyrocketed in this recession and recovery, moving up by 6.2 and 2.8 percentage points to their highest recorded readings.
In supporting households of color throughout the recovery, the policies of the Biden-Harris Administration have boosted overall productivity and growth prospects, leading to a more resilient economy, benefitting all Americans.
The actions taken by the Biden-Harris Administration to increase equity are not limited to the recovery itself. Since the passage of ARP, the administration has worked with Congress to pass three other major pieces of economic policy: the Bipartisan Infrastructure Law (BIL), the CHIPS and Science Act, and the Inflation Reduction Act (IRA). All three of these pieces of legislation contain provisions that will further enhance equity across race and Hispanic origin for years to come. Together, this trifecta of legislation may allow for the equitable recovery described in this report to grow into an even more equitable expansion.
[1] Based on Blue Chip median forecast from January 2021 for 2020Q4/Q4 and 2021Q4/Q4 appended onto the realized 2019Q4 level. Trend is calculated based on the 2015 to 2019 growth rate of current GDP data.
[2] The typical Black family went from having $13 in wealth for every $100 held by the typical white family in 2019 to $16 in 2022, and the typical Hispanic family went from having $19 in wealth for every $100 held by the typical white family in 2019 to $22 in 2022. Aladangady, Aditya, Andrew C. Chang, and Jacob Krimmel. 2023. “Greater Wealth, Greater Uncertainty: Changes in Racial Inequality in the Survey of Consumer Finances.” FEDS Notes. Board of Governors of the Federal Reserve System, October 18, 2023.
[3] Aladangady, Chang, and Krimmel (2023).
[4] Duzhak, Evgeniya A. 2021. “How Do Business Cycles Affect Worker Groups Differently?” Economic letter. Federal Reserve Bank of San Francisco, September 7, 2021.
[5] Hotchkiss, Julie L., and Robert E. Moore. 2022. “Some Like It Hot: Assessing Longer-Term Labor Market Benefits from a High-Pressure Economy.” International Journal of Central Banking 18 (2): 193-243.
[6] Yagan, Danny. 2019. “Employment from Hysteresis from the Great Recession.” Journal of Political Economy 127 (5): 2505-2558.
[7] Greenstone, Michael, and Adam Looney. 2011. "Unemployment and Earnings Losses: A Look at Long-Term Impacts of the Great Recession on American Workers." Brookings Institution, November 4, 2011.
[8] U.S. Bureau of Economic Analysis. 2022. “Effects of Selected Federal Pandemic Response Programs on Federal Government Receipts, Expenditures, and Saving, 2022Q1 Second.” Table. May 26, 2022.
[9] Gelman, Michael, and Melvin Stephens Jr. 2022. “Chapter 3: Lessons Learned from Economic Impact Payments during COVID-19.” In Recession Remedies, edited by Wendy Edelberg, Louise Sheiner, and David Wessel, 91-122. Washington, D.C.: The Hamilton Project and Hutchins Center on Fiscal & Monetary Policy at Brookings Institution.
[10] Aladangady, Aditya, David Cho, Laura Feiveson, and Eugenio Pinto. 2022. “Excess Savings during the COVID-19 Pandemic.” FEDS Notes. Board of Governors of the Federal Reserve System, October 21, 2022.
[11] Black median wealth actually grew by much more (over 120 percent) in the 1990 recession. However, this is due primarily to the very low level of median wealth held by Black families in 1989. In dollar amounts, the jump in median Black wealth from 2019 to 2022 was substantially larger than from 1989 to 1992. Kennickell, Arthur B., and Martha Starr-McCluer. 1994. “Changes in Family Finances from 1989 to 1992: Evidence from the Survey of Consumer Finances.” Federal Reserve Bulletin 80: 861-882.
[12] Data limitations prevent us from looking at earlier recessions.
[13] For example, there is evidence that households used their EIPs to pay down debt, which would have reduced delinquencies. Parker, Jonathan A., Jake Schild, Laura Erhard, and David S. Johnson. 2022. “Economic Impact Payments and Household Spending During the Pandemic.” Brookings Papers on Economic Activity Fall 2022: 81-130.
[14] Gromis, Ashley, Ian Fellows, James R. Hendrickson, Lavar Edmonds, Lillian Leung, Adam Porton, and Matthew Desmond. 2022. “Estimating Eviction Prevalence Across the United States.” PNAS 119 (21).; Gould Ellen, Ingrid, and Samuel Dastrup. 2012. “Housing and the Great Recession.” The Russell Sage Foundation and the Stanford Center on Poverty and Inequality, October 2012.
[15] U.S. Department of the Treasury. n.d. “Emergency Rental Assistance Program.” Last accessed October 18, 2023.
[16] For all statistics in this paragraph, see Hepburn, Peter, Renee Louis, and Matthew Desmond. 2020. “Racial and Gender Disparities among Evicted Americans.” The Eviction Lab, December 16, 2020.
[17] See Figinski, Theodore F., Richard Sweeney, and Erin Troland. 2023. “Targeted Relief: Geography and Timing of Emergency Rental Assistance Funds.” Unpublished manuscript. Figinski, Sweeney, and Troland (2023) use data from the U.S. Department of the Treasury and the U.S. Census Bureau.
[18] Office of Evaluation Sciences, U.S. General Services Administration, and U.S. Department of the Treasury. 2022. “Equity in the Distribution of the Emergency Rental Assistance Program.”
[19] U.S. Census Bureau. 2023. “Housing Vacancies and Homeownership (CPS/HVS).” Table 16 – Quarterly Homeownership Rates by Race and Ethnicity of Householder: 1994 to Present. Current Population Survey/Housing Vacancy Survey. Last updated August 2, 2023.; Ray, Rashawn, Andre M. Perry, David Harshbarger, Samantha Elizondo, and Alexandra Gibbons. 2021. “Homeownership, Racial Segregation, and Policy Solutions to Racial Wealth Equity.” Brookings Institution, September 1, 2021.
[20] U.S. Department of the Treasury. n.d. “Homeowner Assistance Fund.” Last accessed October 18, 2023.
[21] Attom. 2023. “Foreclosure Activity in First Half of 2023 Ticks Upwards Toward Pre-Covid Levels.” July 13, 2023.
[22] Shrider, Emily A., and John Creamer. 2023. “Poverty in the United States: 2022.” Table A-3 – Poverty Status of People by Age, Race, and Hispanic Origin: 1959 to 2022. U.S. Census Bureau, report no. P60-280. September 12, 2023.
[23] Treasury calculations using data from U.S. Census Bureau. 2022. “America’s Families and Living Arrangements: 2022.” Table A3 – Parents With Coresident Children Under 18, by Living Arrangement, Sex, and Selected Characteristics: 2022. November 17, 2022.
[24] Bauer, Lauren, and Sarah Yu Wang. 2023. “Prime-Age Women are Going Above and Beyond in the Labor Market Recovery.” Brookings Institution, August 30, 2023.
[25] Dinlersoz, Emin, Timothy Dunne, John Haltiwanger, and Veronika Penciakova. 2021. “Business Formation: A Tale of Two Recessions.” Center for Economic Studies, U.S. Census Bureau, working paper no. CES-21-01.
[26] U.S. Census Bureau. 2023. Business Applications: Total for All NAICS in the United States (BABATOTALSAUS). FRED, Federal Reserve Bank of St. Louis. Last accessed October 19, 2023.
[27] There was a large increase in business applications during the second half of 2020, and they have remained elevated ever since: business applications were 59 percent higher in August 2023 than in August 2019. U.S. Census Bureau. 2023. Business Applications: Total for All NAICS in the United States (BABATOTALSAUS). FRED, Federal Reserve Bank of St. Louis. Last accessed October 19, 2023
[28] U.S. Department of the Treasury. 2023. “Treasury Department Report Card: Latino Business Ownership Up, Pandemic Recovery Efforts Helped Grow Latino-owned Businesses.” Press release. October 12, 2023.
[29] Fazio, Catherine E., Jorge Guzman, Yupeng Liu, and Scott Stern. 2021. “How is COVID Changing the Geography of Entrepreneurship? Evidence from the Startup Cartography Project.” NBER, working paper no. 28787.
[30] Hoynes, Hilary, Douglas L. Miller, and Jessamyn Schaller. 2012. "Who Suffers during Recessions?" Journal of Economic Perspectives 26 (3): 27-48.
[31] Buckman, Shelby R., Laura Y. Choi, Mary C. Daly, and Lily M. Seitelman. 2021. “The Economic Gains from Equity.” Brookings Papers on Economic Activity, September 8, 2021.; Hsieh, Chang-Tai, Erik Hurst, Charles I. Jones, and Peter J. Klenow. 2019. “The Allocation of Talent and U.S. Economic Growth.” Econometrica 87 (5): 1439-1474.
[32] Reardon, Sean F, Ericka Weathers, Erin Fahle, Heewon Jang, Demetra Kalogrides. 2022. “Is Separate Still Unequal? New Evidence on School Segregation and Racial Academic Achievement Gaps.” Stanford Center for Education Policy Analysis, CEPA working paper no. 19-06.; Park, Julie J. and Ann H. Becks. 2015. “Who Benefits from SAT Prep? An Examination of High School Context and Race/Ethnicity.” The Review of Higher Education 39 (1): 1-23.; Office for Civil Rights, U.S. Department of Education. 2021. “An Overview of Exclusionary Discipline Practices in Public Schools for the 2017-2018 School Year.” Civil Rights Data Collection. June 2021.; Gopalan, Maithreyi, and Ashlyn Aiko Nelson. 2019. “Understanding the Racial Discipline Gap in Schools.” AERA Open 5 (2).; Kamin, Debra. 2022. “Home Appraised With a Black Owner: $472,000. With a White Owner: $750,000.” New York Times, August 18, 2022.
[33] Bertrand, Marianne, and Sendhil Mullainathan. 2004. “Are Emily and Greg More Employable Than Lakisha and Jamal? A Field Experiment on Labor Market Discrimination.” American Economic Review 94 (4): 991-1013.; Pager, Devah, Bart Bonikowski, and Bruce Western. 2009. “Discrimination in a Low-Wage Labor Market: A Field Experiment.” American Sociological Review 74 (5): 777-799.
[34] Lu, Yao, and Xiaoguang Li. 2021. “Vertical Education-Occupation Mismatch and Wage Inequality by Race/Ethnicity and Nativity among Highly Educated US Workers.” Social Forces 100 (2): 706-737.; Golan, Limor, and Carl Sanders. 2019. “Racial Gaps, Occupational Matching, and Skill Uncertainty.” Federal Reserve Bank of St. Louis Review 101 (2): 135-53.
[35] Kamin (2022).; Freddie Mac. 2021. “Racial and Ethnic Valuation Gaps In Home Purchase Appraisals.” Economic & Housing Research Note. September 20, 2021.
[36] Derenoncourt, Ellora, Chi Hyun Kim, Moritz Kuhn, and Moritz Schularick. 2023. “Wealth of Two Nations: The U.S. Racial Wealth Gap, 1860-2020.” Quarterly Journal of Economics, qjad044.; Bowdler, Janis, and Benjamin Harris. 2022. “Racial Inequality in the United States.” U.S. Department of the Treasury, July 21, 2022.; Harris, Benjamin, and Sydney Schreiner Wertz. 2022. “Racial Differences in Economic Security: The Racial Wealth Gap.” U.S. Department of the Treasury, September 15, 2022.
[37] Bell, Alex, Raj Chetty, Xavier Jaravel, Neviana Petkova, John Van Reenen. 2019. “Who Becomes an Inventor in America? The Importance of Exposure to Innovation.” The Quarterly Journal of Economics 134 (2): 647-713.
[38] Baboolall, David, Kelemwork Cook, Nick Noel, Shelley Stewart, and Nina Yancy. 2020. “Building Supportive Ecosystems for Black-owned US Businesses.” McKinsey & Company, October 29, 2020.; Orozco, Marlene, Inara Sunan Tareque, Paul Oyer, and Jerry I. Porras. 2020. “2019 State of Latino Entrepreneurship.” Stanford Latino Entrepreneurship Initiative, January 2020.
[39] Bartik, Timothy J. 2020. “Using Place-Based Jobs Policies to Help Distressed Communities.” Journal of Economic Perspectives 34 (3): 99-127.