I. Introduction
As we approach the fifth anniversary of the onset of the COVID-19 pandemic, the United States is experiencing robust economic growth and low unemployment. At the same time, inflation is approaching the Federal Reserve’s price stability target, consistent with a “soft landing” that many thought impossible. Against that backdrop, it can be easy to forget just how precarious the American economy seemed in 2020. As more than a million Americans lost their lives and millions of businesses closed to contain the pandemic, our country faced a unique recession with no modern precedent. In the fall of 2020, forecasters foresaw a prolonged shortfall in demand and expected unemployment to stay above 6 percent through 2021.[1]
This report unpacks the post-pandemic recovery and explores the impact of the choices our country made. Section II describes the current state of the economy in an absolute sense, identifying the significant strengths of the domestic economy, but also some of its important vulnerabilities. To identify the impact of our policy choices and to help learn from them, Section III assesses the expansion relative to three important counterfactuals: other countries’ experiences recovering from COVID, a history of previous U.S. expansions, and the expectations of economic forecasters during the pandemic. We show that conditional on the gravity of the COVID pandemic, the recovery has been exceptionally strong.
Section IV goes on to address two of the most challenging macroeconomic questions surrounding this recovery. First, was the rise in inflation in 2021 and 2022 a necessary cost of avoiding the depression-like conditions many forecasters expected? And second, how has inflation come down to today’s low levels without triggering significant weakness in the labor market? When addressing these questions, we explain that pursuing macroeconomic policies that would have lessened inflation early in the pandemic would have come with major downside risks to the economy. Furthermore, we highlight research that suggests that even if such policies been adopted, inflation would have been only slightly lower at its peak. In other words, the U.S. economy was unable to achieve a “soft landing” until later in the recovery, only after pandemic-era social distancing ended, supply chains unsnarled, and aggregate supply expanded.
Finally, Section V considers the impact of recent supply-side investments on the economic outlook. With unemployment low and inflation almost back to target, it is time for policymakers to double down on supply-side investments like those in the Bipartisan Infrastructure Law (BIL), the CHIPS and Science Act, and the Inflation Reduction Act (IRA). Already, we are seeing promising signs of future growth: surges in business applications, the construction of clean energy manufacturing facilities, and public sector infrastructure investment. The new businesses, manufacturing, and infrastructure that come online over the next decade will boost productivity and create good jobs for years to come. Further supply-side investments are needed in housing, childcare, and vocational training to help strengthen our human capital stock for the long run.
II. The State of the U.S. Economy in 2024
According to the most recent economic indicators, the U.S. economy is in a position of strength. Labor market, household, and business indicators are all at levels typical of economic booms, with some—including the prime-age (ages 25 to 54) labor force participation rate, median household wealth, and business applications—at or near historic highs. Inflation and interest rates, which have been major sources of strain for American households over the past few years, have eased from their peaks.
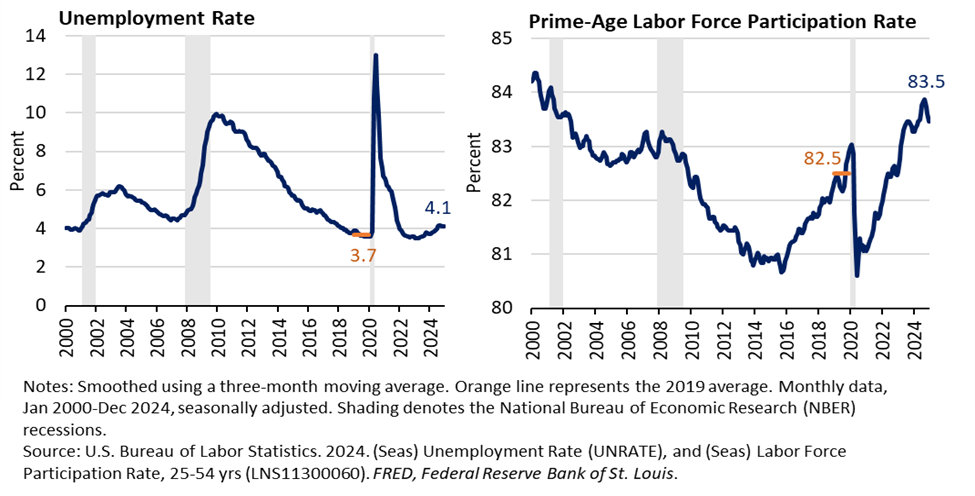
Unemployment remains low, and the prime-age labor force participation rate is higher than it has been in two decades (Figure 1). As a result, the employment to population ratio for prime-age Americans is also historically high, and the United States added over 2.2 million jobs in 2024. Since the onset of the pandemic, wages have also risen rapidly, outpacing inflation. The median worker could purchase in 2024 what they purchased in 2019 and still have $1,600 left over.[2] Lower-income workers have seen the largest relative gains in their real wages.[3]
Figure 1: Unemployment and Prime-Age Labor Force Participation Rate
Households across the income distribution have reaped the gains of the strong labor market, along with generous pandemic-era support. According to the Survey of Consumer Finances, median household wealth reached its highest-ever level in 2022, the latest available year, even after adjusting for inflation.[4] The gain between 2019 and 2022 for the median household was larger than any three-year increase seen in the history of the series.
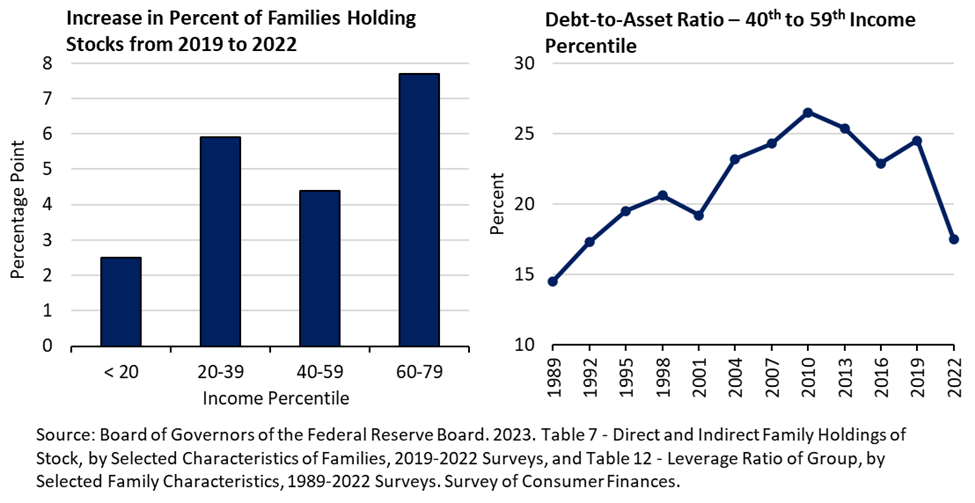
Other aspects of household balance sheets have also improved. The left-hand chart of Figure 2 shows that all income quintiles experienced a rise in the percentage of households holding equity investments, suggesting that even some low-income households have been able to benefit from the booming stock market. The leverage ratio—the ratio of debt to assets held by households—decreased for all income quintiles to the lowest levels in more than twenty years.[5] The leverage ratio for the median income quintile is shown in the right-hand chart.
Figure 2: Household Balance Sheets
Businesses are also flourishing, and business dynamism is high. Business sales, when adjusted for inflation, are about 10 percent higher than their pre-pandemic level, and small business applications have been at historically elevated levels since 2020 (Figure 3).
Figure 3: Business Sales and Business Applications
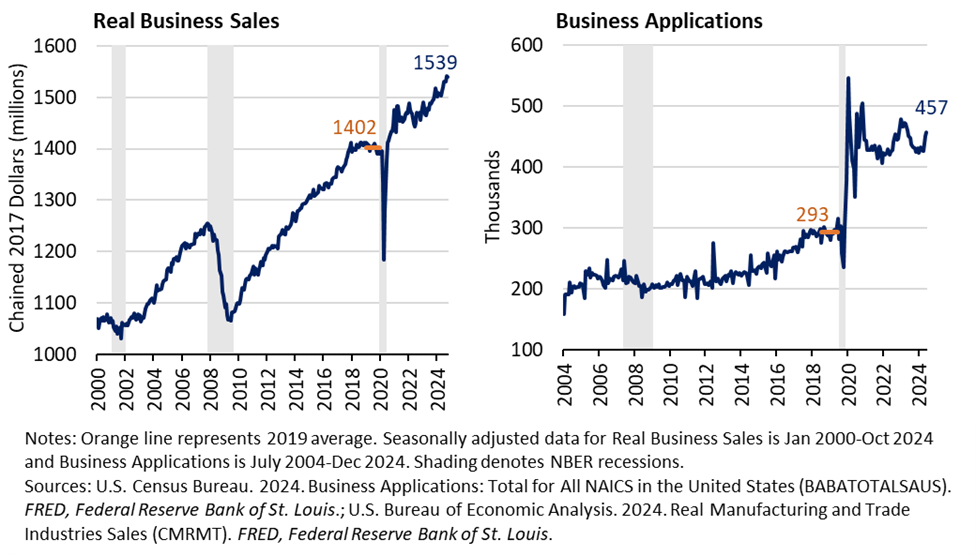
Since 2019, over 25 million applications for businesses have been filed, as compared to 16 million in the five years leading up to the pandemic. Furthermore, increases in entrepreneurship—as measured by the number of self-employed workers—have been equitably shared by gender, race, and ethnicity.[6] And because the stock market is also an indicator of people’s expectations about firms’ profits, its high level reflects optimism by investors.
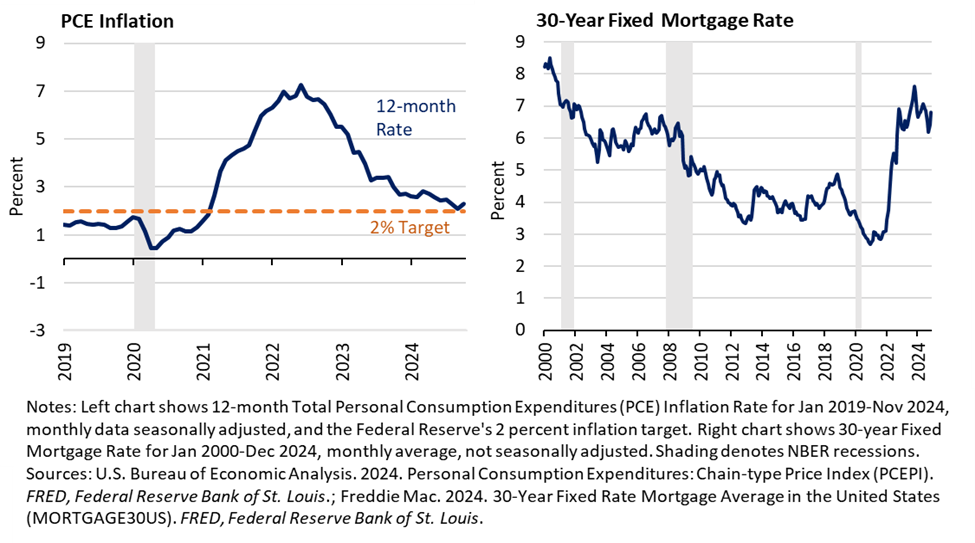
Despite these strengths, elevated prices and interest rates remain challenges to many in an otherwise robust economy. American households have felt the strain of rising prices and high interest rates over the past few years. Even so, these indicators are trending in the right direction (Figure 4). Inflation has come down close to pre-pandemic levels and is approaching the Federal Reserve’s two percent inflation target. In addition, consumer interest rates appear to have peaked, and some are turning down, including mortgage rates, which are down about 0.9 percentage points from their peak of 7.6 percent in 2023.
Figure 4: PCE Inflation and 30-Year Fixed Mortgage Rate
III. The U.S. Economy in Context: International, Historical, and Forecast Comparisons
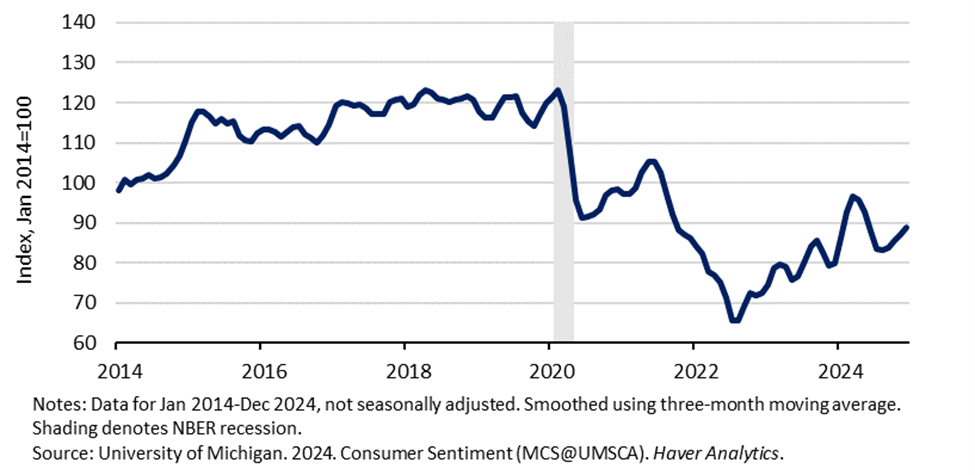
Despite the economic strength reflected in the macroeconomic indicators reviewed in the previous section, consumer sentiment remains well below its pre-pandemic levels, as shown in Figure 5. One plausible explanation for this discrepancy is that longstanding adverse economic trends—such as rising housing, childcare and medical costs—have resulted in a decline in middle-class well-being. The result is that many Americans feel that the economy is just not working for them. For this reason, it is essential that policymakers address these issues with vigor, as we touch upon in Section V.
Another explanation for the dissatisfaction is that the price level weighs heavily in consumers’ assessments of the economy. Between 2020 and 2024, the price level increased over 20 percent. Prices today are more than 10 percent higher than they would have been had inflation increased at its trend rate over this period.
Figure 5: Consumer Sentiment
But the pandemic did happen. And the truth is that the pandemic’s impact on the economy could have been much worse under a different set of policies. In this section, we make that case, showing that in the absence of the policy response in the years following the pandemic, the state of the economy would be much weaker today.
We take three main approaches. First, we compare U.S. economic outcomes to those in other advanced countries, which had much weaker fiscal responses than ours. Second, we compare the ongoing recovery to those from previous recessions. Finally, we compare the current state of the economy to benchmark economic forecasts, both after the pandemic hit and in recent years. While none of these comparisons alone are perfect, they all point in the same direction: the U.S. economy is not just strong, but it is uniquely strong when judged against what could have been.
International Context
We first turn to international comparisons. During the pandemic, the world was buffeted by a wide array of shocks. Russia’s unlawful invasion of Ukraine put upward pressure on energy and food prices. Supply chain shortages further ratcheted up prices as global demand outstripped global supply. These pandemic-era shocks had disparate impacts on countries around the world as they fed through the global economy. There is evidence that the effects from global energy shocks more strongly impacted inflation in Europe than in the United States, for instance.[7] In addition, policymakers took different approaches to respond to the pandemic, which is reflected in aggregate economic data.
Even with these caveats, we can assess the relative strength of the U.S. economy compared to its G7 peers. We find the U.S. economy is uniquely strong, in part because fiscal policy supported demand at home.
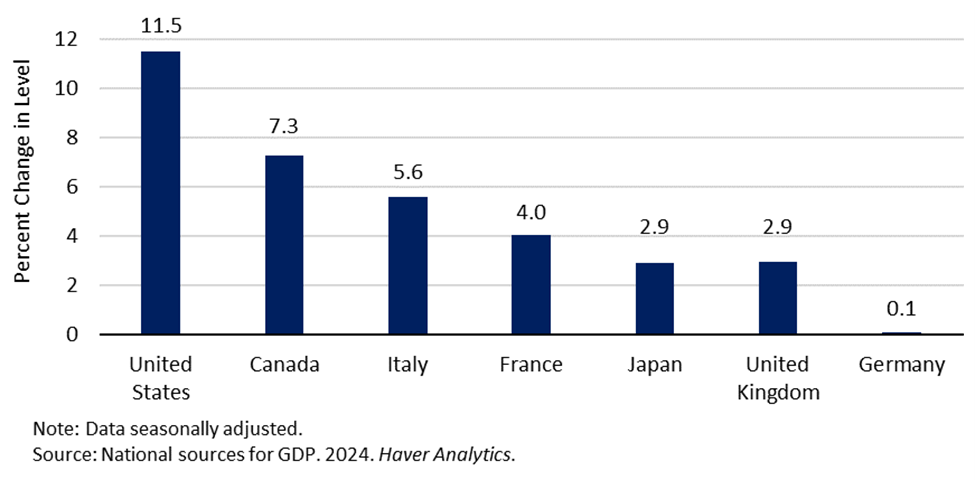
First, we examine economic growth (Figure 6). In all G7 economies, real GDP has risen above pre-pandemic levels, but has grown much more in the United States than any other country. Specifically, U.S. real GDP was 11.5 percent higher in the third quarter of 2024 than at the end of 2019. Canada and Italy had the next highest growth at 7.3 percent and 5.6 percent, respectively, roughly half that of the United States.
Figure 6: Real GDP Growth from Q4 2019 to Q3 2024
Much of the United States’s relative economic strength was supported by its remarkable productivity growth, which far outstripped the productivity gains in other G7 countries.[8] In addition, part of the divergence in growth is driven by whether a country is a net energy exporter or importer. Net energy exporters, like the United States and Canada, recovered faster than net energy importers, which make up the remainder of the G7. Nonetheless, as of Q3 2024, the United States is the only G7 economy to have recovered to its pre-pandemic growth trend; real output is now 1.0 percent above what the pre-pandemic trend would have predicted. In comparison, the next closest country is Italy—0.5 percent lower—and the largest shortfall is Germany, which is 8.7 percent lower than trend.
Next, we consider labor markets. Comparing labor markets across countries is particularly tricky. In each country, labor markets are shaped by distinct institutions, laws, and cultures, which affect the country’s natural rate of unemployment. Furthermore, governments responded to the pandemic in distinct ways, each of which had different implications for pandemic-era unemployment.[9] For instance, the United States and Canada provided substantial support directly to households in the form of stimulus checks or unemployment insurance, which led to a larger spikes in their unemployment rates than in other countries.[10] In contrast, the U.K. and Japanese governments primarily subsidized firms to maintain workers on their payrolls.[11]
Figure 7: Unemployment Rates Across the G7, 2020-2024
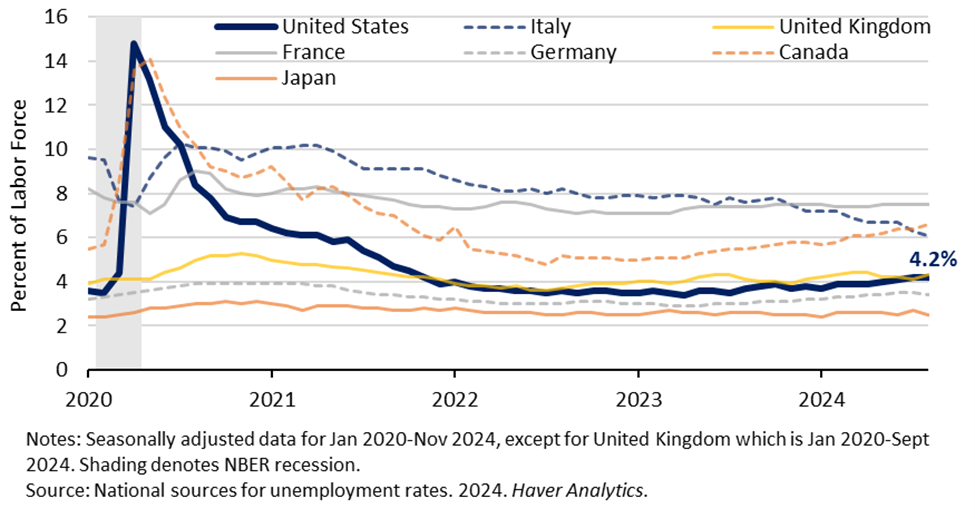
However, after the initial shock from the pandemic lockdowns, the U.S. unemployment rate rapidly improved, falling below its pre-pandemic rate for the first time in January 2023. As of November 2024, most G7 countries have seen their labor markets largely recover.
Wage developments further demonstrate the disproportionate labor market recovery for U.S. workers. Figure 8 shows the growth in average real wages from Q4 2019 to Q3 2024.[12]
Figure 8: Real Wage Growth, Total Private Sector, Across the G7, 2019-2024*
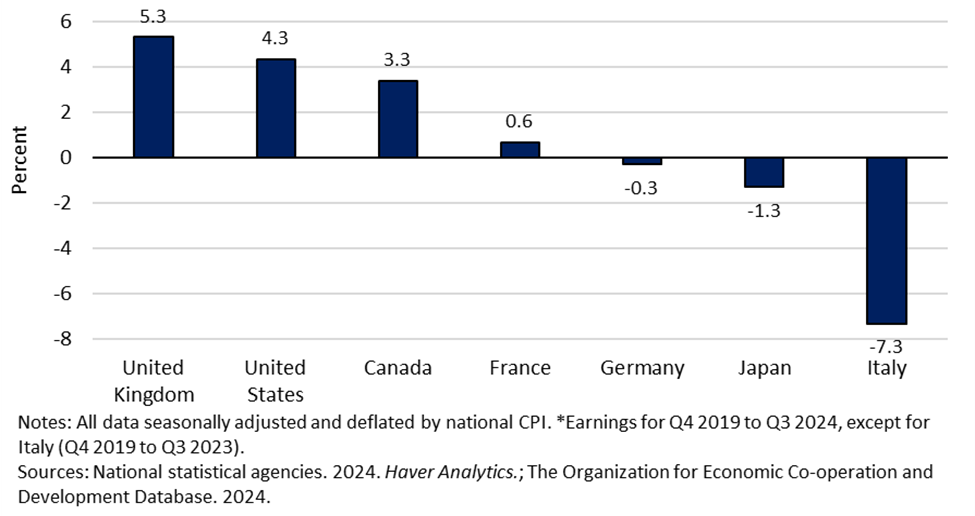
Real hourly wages in the United States are 4.3 percent higher than in 2019; apart from the United Kingdom and Canada, no other G7 country experienced positive real wage growth of a substantial magnitude over this period. In fact, except for the United Kingdom and Canada, workers in other G7 countries are now earning lower or essentially unchanged real wages on average compared to what they earned in 2019.
Figure 9: Real Wage Growth, Manufacturing, Across the G7, 2019-2024
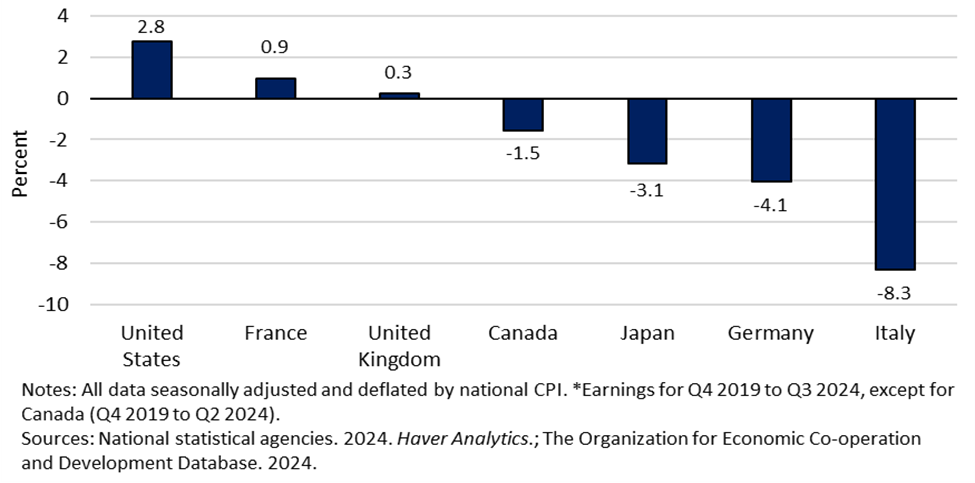
The comparison with manufacturing wages across the G7 is even more stark.[13] American manufacturing workers experienced a 2.8 percent increase in real wages between Q4 2019 and Q3 2024. Workers in other G7 countries, except for France and the United Kingdom, saw a decline.
Lastly, inflation. Cross-country comparisons of inflation are not simple because countries have different standards as to what is included in their inflation consumption baskets—most notably regarding owners’ equivalent rent (OER, or the imputed rental value of housing services received by homeowners). The United States includes OER in its CPI measure, whereas European inflation statistics do not. To address this problem, we use the core measure of the Harmonized Index of Consumer prices, which excludes food, energy, and OER to enable more accurate cross-country comparisons.
Figure 10: Harmonized Core CPI Inflation Rates
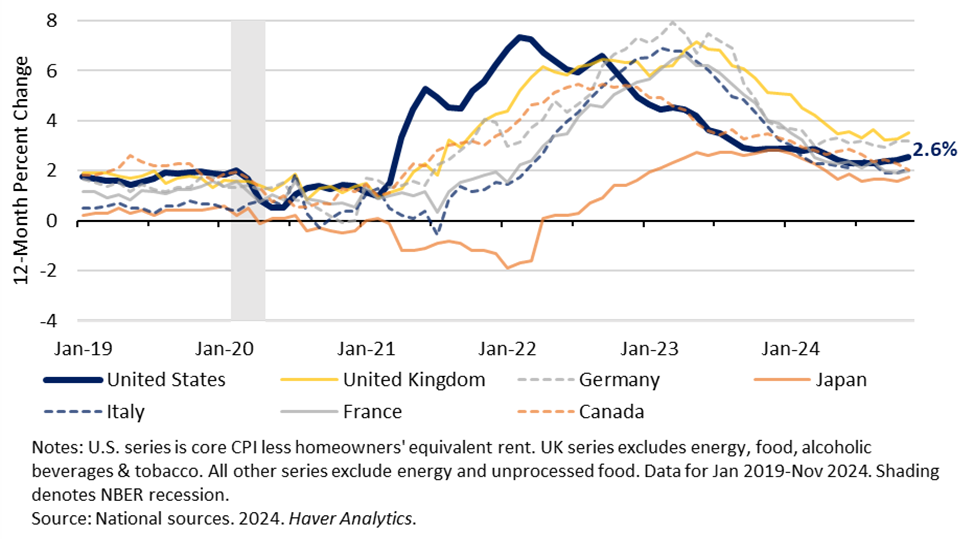
Across the industrialized world, inflation was a persistent phenomenon coming out of the pandemic. U.S. core CPI inflation (excluding food and energy), though quick to take off, has since declined significantly. As of November 2024, inflation measured by U.S. harmonized CPI stands at 2.6 percent, near the Federal Reserve’s 2 percent target rate.[14] U.S. inflation fell earlier than most other G7 countries—all while the economy has maintained strong growth and a historically strong labor market, with a low unemployment rate and robust wage growth. Other G7 economies have since seen inflation decline, though with significantly weaker economies.[15]
Past Recoveries
Recessions often have distinct proximate causes. For instance, the 2001 recession was caused by the bursting of the dot-com bubble and amplified by the 9/11 terrorist attacks, the 2008–2009 recession was caused by the subprime mortgage and housing market crisis, and the 2020 recession was caused by reverberations from a once-in-a-century pandemic. Nonetheless, the economy’s responses to those shocks share similarities in each case—enough to justify cross-recession comparisons. Recessions are characterized by a rise in the unemployment rate, with disproportionate increases for lower-wage and Black and Hispanic workers, a drop in asset prices, and a decline in business investment. And all recessions have the potential to be amplified by the same vicious cycle—the “multiplier effect”—with lower household income and wealth leading to reduced spending, leading to lower labor demand, leading to lower household income, and so on. Any large negative shock to the economy comes with some similar risks, and the policy response will be integral in determining the path of the economy, no matter the cause.
In this subsection, we compare the speed and size of this recovery against previous ones. In many instances, that comparison is stark: recovery from the pandemic-era recession is the strongest and most equitable recovery on record.
First, the U.S. labor market has recovered remarkably quickly compared to previous recessions. Figure 11 plots the unemployment rate relative to the previous business cycle peak—the month before which important aggregate variables such as employment, industrial production, and consumption decline—for the previous four recessions.
Figure 11: Unemployment Rate Paths, Comparison Across Recessions
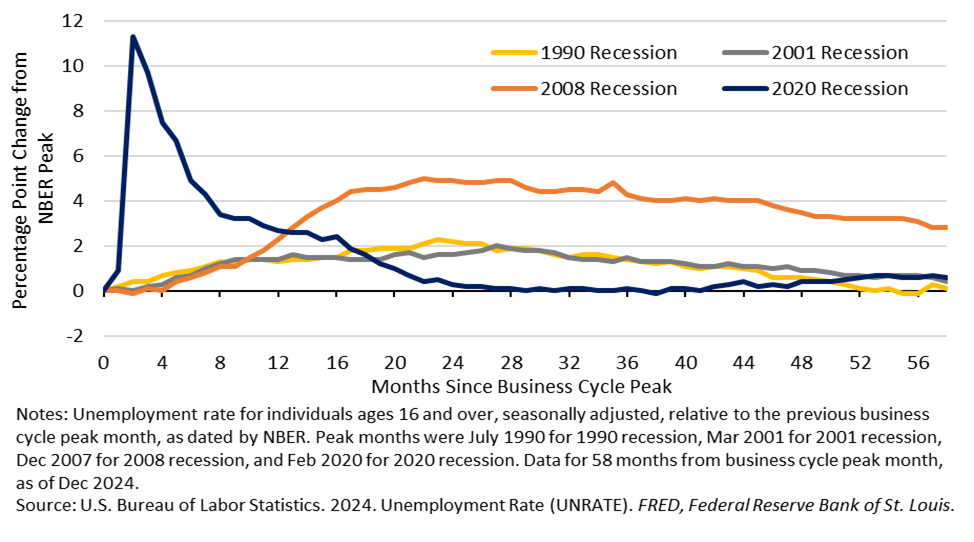
After suffering the largest unemployment spike in living memory during the pandemic, the unemployment rate recovered to its pre-pandemic level in almost two years. In contrast, it took longer than four years for the unemployment rate to recover in the previous three recessions. The prime-age labor force participation rate made a similarly fast recovery, recently reaching its highest value in 20 years.
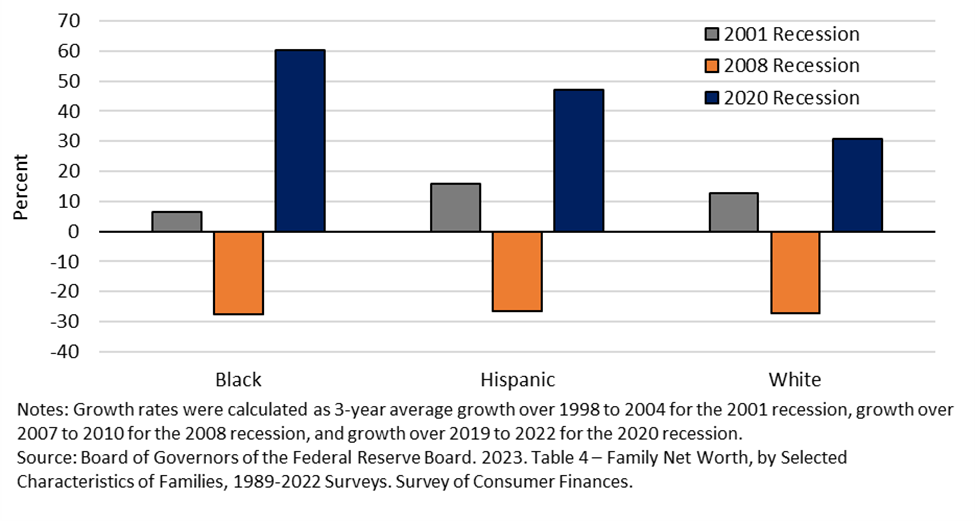
Second, measures of household balance sheets have also recovered faster than in previous recessions. Notably, between 2019 and 2022, real median household wealth grew 37 percent, the largest three-year percent increase since the modern Survey of Consumer Finances started in 1989.[16] Real wealth growth was dramatically different than what occurred in the previous two recessions. The contrast with the Great Recession of 2008–2009 is particularly stark—between 2007 and 2010, real wealth fell 39 percent for the median family. Furthermore, the rise in wealth was felt quite broadly, including for the median Black and Hispanic families (shown in Figure 12), and for lower income families.[17]
Figure 12: Changes to Real Median Wealth over Recessions and Recoveries by Race and Hispanic Origin
Measures of stock market value also show strength in the recent recovery compared with the two previous recessions, as shown in Figure 13. While stock market wealth is disproportionately held by higher income households, an increasing number of low-income households also hold stock market wealth (as previously shown in Figure 2), some indirectly in retirement accounts or pensions. Thus, many households across the distribution have benefited from the stock market’s strength.
Figure 13. Real Financial Market Share Prices, Comparison Across Recessions

Finally, businesses have also fared better and invested relatively more in the post-pandemic recovery than in previous recessions. Figure 14 shows business investment as a share of GDP since the COVID business cycle peaked compared to the period following the Great Recession.
Figure 14: Business Fixed Investment as Share of GDP Across Business Cycles
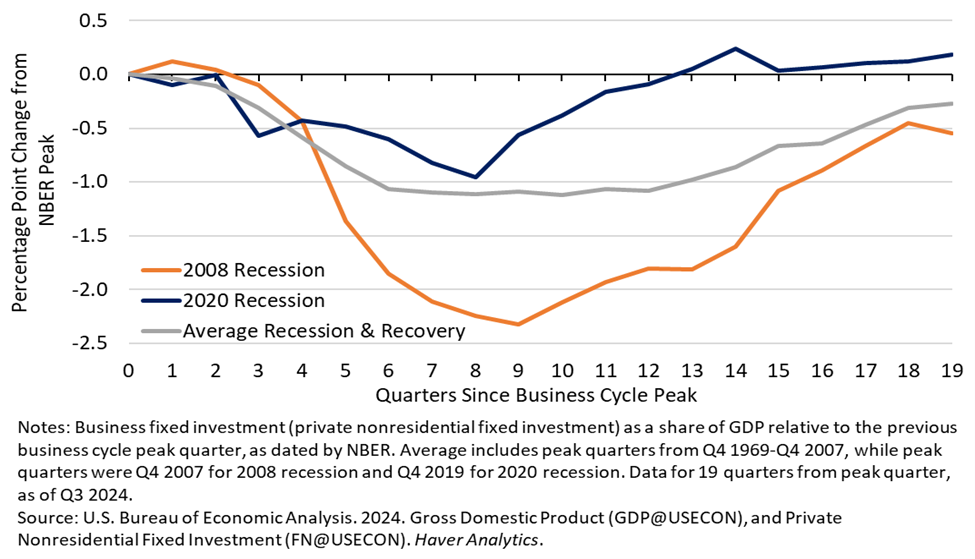
Typically, investment tends to fall as a percent of GDP in a recession and continues to contribute less into the recovery, as was the case in 2008. In recent years, business investment has bucked that trend.[18] As a share of GDP, it has fallen less and recovered faster than any recession since the 1980s. Indeed, businesses have invested $627 billion more this cycle than if investment followed those historical patterns.
Figure 15: Changes in Business Ownership over Recessions and Recoveries
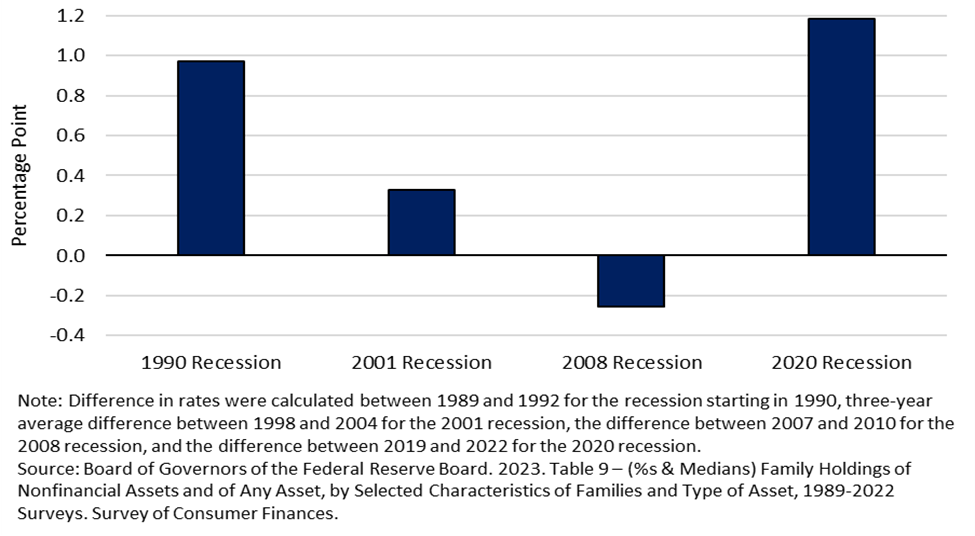
Business ownership shows the same encouraging signs: another indicator suggesting that entrepreneurship has risen. Figure 15 shows the three-year percent change in business ownership over every recession and subsequent recovery since the 1990s. As seen below, business ownership has boomed during the recovery from the pandemic. The increase has also been historically equitable, with Black and Hispanic rates of business ownership skyrocketing between 2019 and 2022 to their highest recording readings at 11.0 and 9.8, respectively.[19]
In sum, the U.S. economy’s recovery from the pandemic outperformed other recent U.S. recoveries by several key metrics. These included the strength of the labor market, household balance sheets, and business dynamism and health. Given the magnitude of the initial pandemic-induced shock—a nearly 8 percent decline in GDP in one quarter and a jump in the unemployment rate to almost 15 percent—the usual multiplier effect could have transformed that shock into a much worse recession and weak recovery. There was real reason to expect that the recovery from the COVID recession would be at least as bad—and possibly much worse—than in prior business cycles.
Comparisons to Economic Forecasts
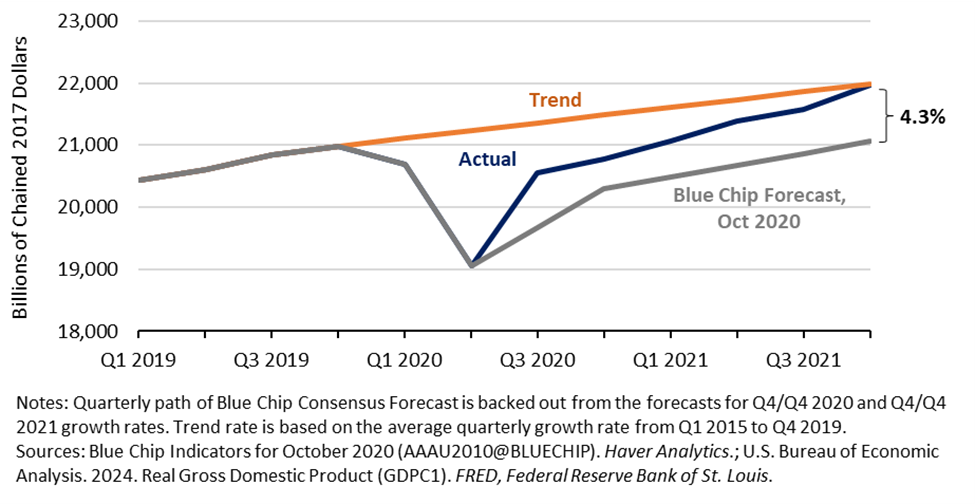
Finally, forecasts provide yet another window into what could have been. The forecasts in the spring of 2020 were particularly dire and uncertain, as analysts struggled to adapt their models to a once-in-a-century pandemic. But as the year wore on, statisticians were able to model the spread of the disease with greater certainty and large-scale fiscal and monetary stimulus began to fortify the economy. Even so, in October 2020, forecasters still expected the large shock to the economy to have lingering effects: the unemployment rate was expected to remain close to 6 percent and GDP expected to languish more than 4 percent below its prior trend at the end of 2021.
Instead, the unemployment rate fell to 3.9 percent by December 2021, and real GDP growth was robust, reaching its pre-pandemic trend by the fourth quarter of that year, more than 4 percent higher than the Blue Chip Consensus Forecast from October 2020 (Figure 16). Furthermore, the labor market has remained historically strong since then, and real GDP has kept growing at a strong pace. In fact, the U.S. economy is now expected to be more than 10 percent larger by the end of 2024 than the IMF had forecasted in October 2019, before the onset of the pandemic.[20]
Figure 16: Actual versus Forecasted GDP
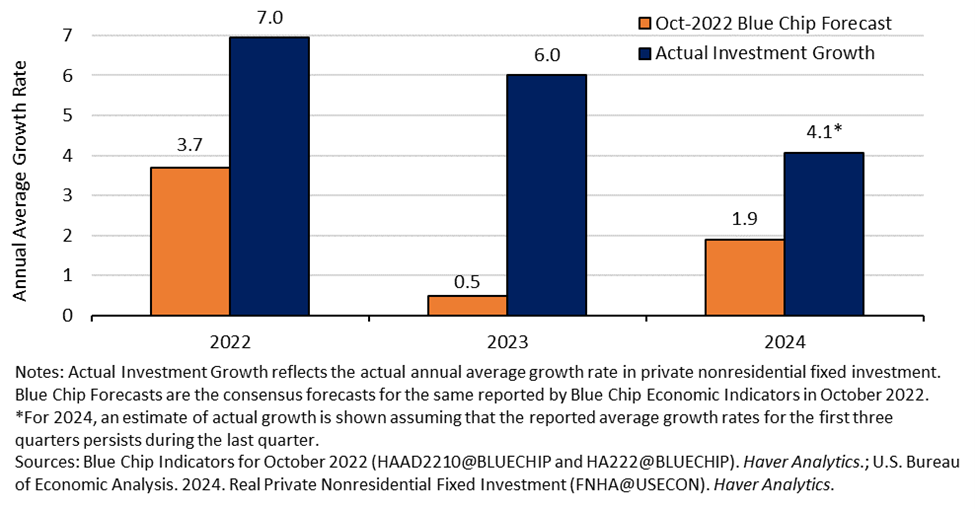
Not only has the economy outperformed expectations formed at the height of the pandemic, but it has outperformed expectations formed later in the recovery. In 2022, with interest rates and the cost of borrowing rapidly rising, forecasters revised down their estimate of business investment. But, as shown in Figure 17, business investment growth vastly outperformed those October 2022 expectations.
Figure 17: Real Business Fixed Investment Growth vs. Forecasts
From the vantage point of October 2022, the subdued expectations for business investment extended to the economy more broadly. In anticipation of a “hard landing”—that is, a downturn brought on by the high rates used to combat inflation—Blue Chip forecasters expected that a recession was more likely than not in 2023.[21] Instead, real GDP grew 3.2 percent over the four quarters of 2023. This strength has continued through 2024. The latest data suggest that inflation is stabilizing close to its pre-pandemic rate and that the unemployment rate remains historically low—it appears that the U.S. economy achieved a soft landing.
IV. The inflation-output tradeoff
Finally, we turn to discuss a central question surrounding this recovery. Could policymakers have engineered a recovery from the pandemic recession with today’s economic strength but without the high inflation of the past four years? This outcome would have been difficult to achieve early in the recovery, as lower inflation tends to be accompanied by higher unemployment. But in recent years, inflation has cooled while keeping unemployment low, principally due to an expansion of the supply side of the economy.
Inflation tends to rise when either the demand for goods and services increases sharply by more than producers can easily handle, or when the supply of goods and services contracts without a simultaneous contraction in demand. Pandemic-era inflation was driven by both processes. Aggressive monetary and fiscal policy along with the excess savings households accumulated in the early pandemic served to push aggregate demand above pre-pandemic levels. At the same time, the U.S. economy faced a series of supply shocks. Global factory closures, chip shortages, port shutdowns, and shipping congestion adversely impacted supply chains worldwide. Restaurants, hotels, and other retailers faced labor shortages in 2021 and 2022 as re-entry to the labor force lagged the opening of the service economy. Together, heightened demand alongside supply constraints put severe upward pressure on prices of both goods and services.[22]
Less stimulative macroeconomic policy may have reduced price pressures but would have had adverse consequences for Americans. Fewer transfer payments would have meant less support for the 10 million people who had become unemployed or had left the labor force by the end of 2020, leaving many families without enough food or essential items.[23] As these consumers spent less, businesses would have suffered and employed fewer workers. Higher interest rates aimed at limiting inflation earlier in the pandemic recovery would have put the brakes on the economy, slowing GDP and employment growth when the recovery was still far from complete. In short, lower inflation would have come with a tradeoff—lower economic growth and employment—which means higher unemployment, lower wages, and reduced well-being. This can be seen in Figure 18, which plots illustrative aggregate supply and demand curves.
Figure 18: Illustrative Supply-Demand Curves
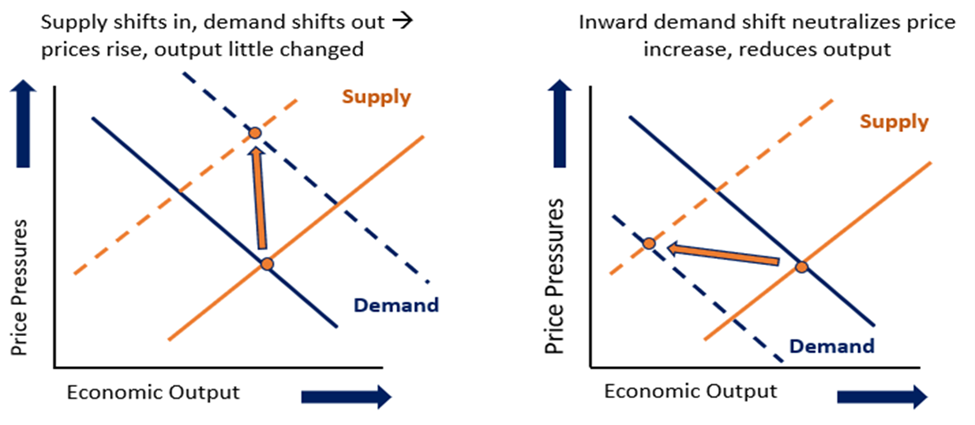
The left-hand figure shows supply shifting in (to the orange dotted line) while demand shifts out (to the blue dotted line)—as we experienced during the pandemic. As shown by comparing the before and after intersections of the supply and demand curves, price pressures increased substantially, but economic output was little changed. On the other hand, the right-hand figure shows that demand would have had to shift inward to neutralize the price pressures resulting from the contraction in supply. In this case, inflation is successfully tamped down, but economic output is much lower.
One way of quantifying this tradeoff is by considering the sensitivity of inflation to a demand-induced contraction in employment—in other words, the slope of the Phillips Curve. The Phillips Curve suggests that increases in inflation are often associated with decreases in the unemployment rate, and vice versa.[24] Empirical estimates of this relationship quantify the unemployment-inflation tradeoff and give us a sense of how much more unemployment, resulting from alternative fiscal and monetary policies, would have been necessary to keep inflation at the Fed’s 2 percent target.
Using empirical estimates from two representative models of the Phillips Curve, we found that the unemployment rate would have needed to rise to 10 to 14 percent, on average, throughout 2021 and 2022 to keep inflation at 2 percent.[25] This equates to an additional 9 to 15 million people out of work during those years. That implies significant additional hardships on the affected families, and corresponds to a much weaker economy overall, with much weaker household balance sheets, wages, business sales, and stock prices.
Other models suggest that when labor markets are very tight, it may be possible to reduce inflation with smaller rises in unemployment.[26] Nevertheless, the sheer magnitude of the results associated with the simple Phillips Curve model demonstrates the implausibility of pursuing policies that would have fully prevented excess inflation in the face of the supply shocks seen during the pandemic era.
Some studies show that even if tighter policy been pursued, the peak in inflation would have been only slightly lower. One analysis from economists at the Federal Reserve Bank of New York found that with tighter policy, unemployment would have risen to 7 percent at the end of 2022 and remained well above 6 percent through the end of 2023, rather than below the 4 percent we experienced. However, the study found that temporary supply constraints contributed about three fourths of the increase in median CPI inflation during this period and would have occurred anyway. This means that, even with higher unemployment rates, peak core PCE inflation would have been only one percentage point less than the 5.6 percent that occurred.[27],[28] Another analysis found that earlier monetary tightening would have led to unemployment rates over 6 percent going into 2023, with similarly modest reductions in inflation—only about 1 percentage point less than peak for core PCE inflation.[29]
None of these estimates are unassailable, but they highlight the magnitude of the risks faced by policymakers around the world.
Indeed, because of the tradeoff between inflation and employment, many forecasters thought it impossible to bring down inflation at all without the cost of higher unemployment. As of the end of 2022, Blue Chip forecasters’ probability of a recession the following year was over 62 percent. And, yet, as of the latest data in November 2024, the three-month PCE inflation rate is down to 2.3 percent, the labor market remains historically strong, with the December unemployment rate at 4.1 percent, and forecasters’ assessment of recession risk was cut in half.[30] So far, it appears that a “soft landing” has been achieved, albeit with ongoing risks.
So how did this happen? As the discussion above illustrates, one way to improve the inflation-output tradeoff is to increase supply. And supply has expanded notably during the past few years. The labor force rebounded due to the widespread availability of vaccines and the gradual fading of pandemic restrictions, while supply chains unsnarled because of private sector efforts and active measures taken by the Biden-Harris Administration to support them.[31] Labor force participation rates of prime-age workers have reached historic highs, and an increase in legal immigration was essential to closing the labor shortages of 2021 and 2022. This increase in supply happened simultaneously with increasing interest rates, allowing a gradual alignment of supply and demand that would not have been possible to achieve earlier in the pandemic period.
V. Looking ahead: investing in our American productive capacity
With the work of the recovery of the pandemic recession largely complete, the focus of macroeconomic policy should be on investing in the supply side: boosting productivity growth, spurring innovation, increasing the amount of capital deployed toward growing our economy, and investing in our workforce. Indeed, policies designed to expand the economy’s productive capacity have been a key focus of the Biden-Harris Administration, including the investments made in the BIL, the CHIPS and Science Act, and the IRA. This section highlights three areas for optimism around the economy’s supply-side trajectory: post-pandemic surges in entrepreneurship, high-tech manufacturing, and public infrastructure. But challenges remain that will require new legislation.
New Business Formation
The post-pandemic economy, with its high levels of household wealth, consumer spending, and renewed support for small businesses, has kick-started entrepreneurship. The creation of new businesses reflects the formation of new financial and human capital, which increases our country’s productive capacity. Small businesses account for about half of total private employment and have created a disproportionate share of jobs since the pandemic, contributing more than 70 percent of net private job gains since the fourth quarter of 2019.[32]
There has been a pronounced surge in applications to start new businesses since the pandemic, with over 21 million new applications since the end of 2020. As shown in Figure 3, that pace remains well above the steady pre-COVID rate even in the latest reported data.[33]
Figure 19. New Business Applications
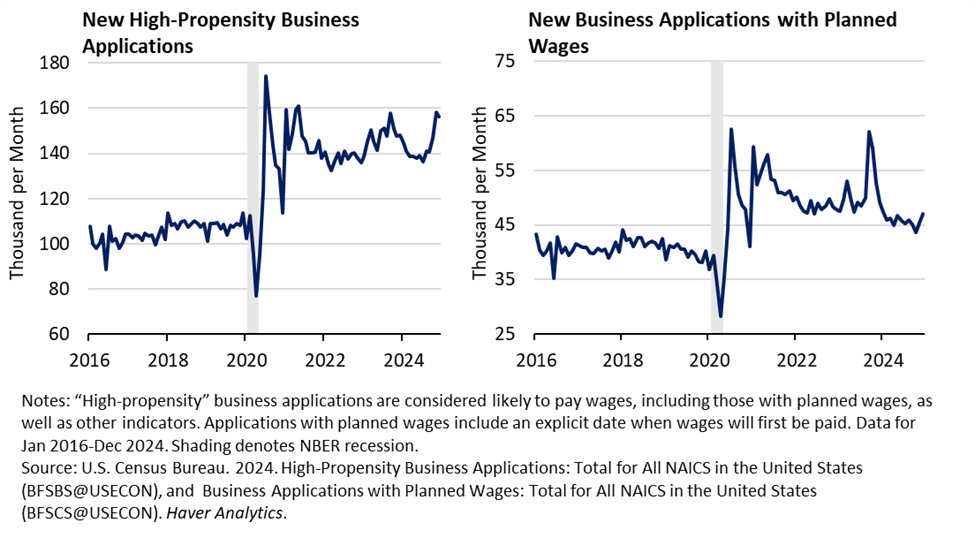
The surge in business applications following the pandemic is so sharp that one might wonder whether it truly reflects a rise in entrepreneurship, or instead some measurement artifact related to a pandemic-era distortion. However, several pieces of evidence suggest that the surge is real.
First, as shown in Figure 19, the surge is not confined to the broadest set of business applications, which includes many sole proprietorships or other entities that may not fit prevailing understandings of a “small business.” A similar surge is present for those applications the Census considers having a high propensity to pay wages (left panel), as well as those who indicate a date on which they will begin paying wages (right panel).
Second, the surge follows the patterns of broader post-COVID economic changes. Haltiwanger (2022) showed that the surge was concentrated in industries likely well-suited to a work-from-home environment, such as non-store retailers and professional, scientific, and technical services.[34] Decker and Haltiwanger (2023) examined the geographic distribution of applications and showed they were concentrated in “donuts” around urban centers, consistent with post-pandemic residential and workplace shifts.[35] CEA (2024) examines a broader set of administrative data that helps establish the veracity of the surge.[36]
There are many candidate explanations for the surge: the actions taken by the Biden-Harris administration to support small businesses, the prevalence of remote work or the gig economy making the decision to start a business less costly or risky, the rise in household wealth experienced since the pandemic enabling more people to risk opening businesses, or even a broader shift in cultural attitudes toward risk-taking. In any case, we observe that more Americans are starting small businesses at a faster rate just as those businesses are playing a growing role in our economy.
High-Tech Manufacturing
Another trend with forward-looking promise is the boom in construction of manufacturing facilities—factory building—since the passage of the CHIPS and Science Act and the IRA in 2022. As shown below in Figure 20, the pace of factory construction of computer, electronic, and electrical facilities has more than doubled since then, with the increase concentrated in high-tech manufacturing facilities: including semiconductor manufacturers and producers of electric vehicle (EV) batteries and other clean technology. Building new factories is also a form of new capital formation—led by private investment encouraged with public incentives—that, by deepening U.S. capacity in semiconductor production and clean energy, should help expand productivity growth.
Figure 20. Manufacturing Construction: Real Spending by Type
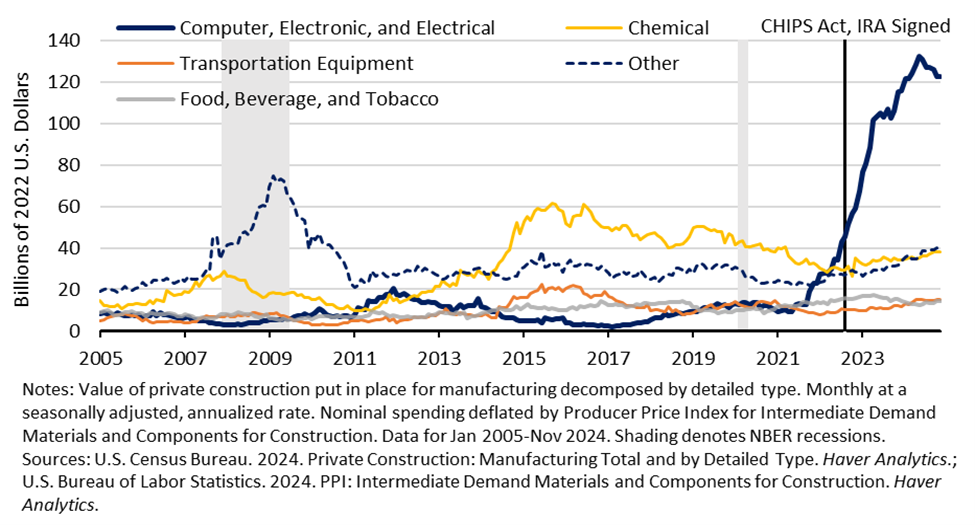
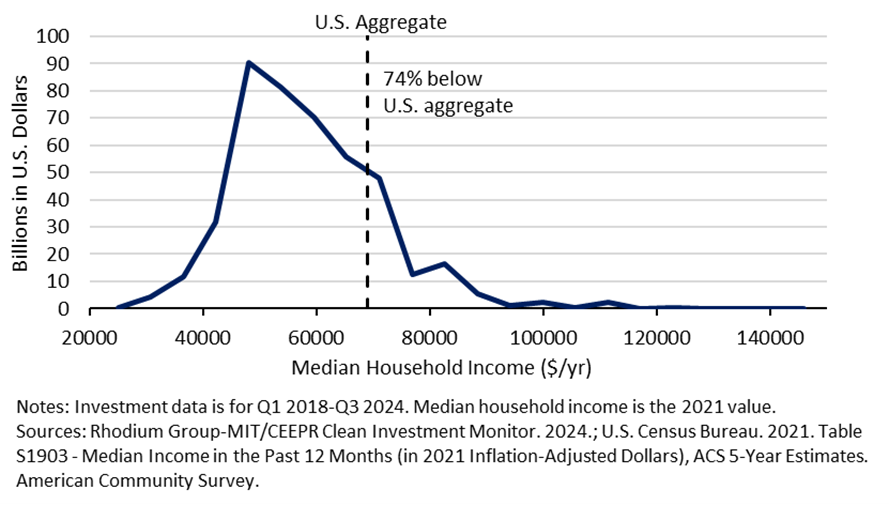
Importantly, clean energy investments stand to benefit the way economic growth is distributed. Almost three quarters of announced investments in clean energy since the IRA was passed are going to counties with median household incomes below the national average, as shown in Figure 21.
Figure 21: Distribution of Median Household Income Across Counties of Post-IRA Clean Investment Announcements
Public Infrastructure
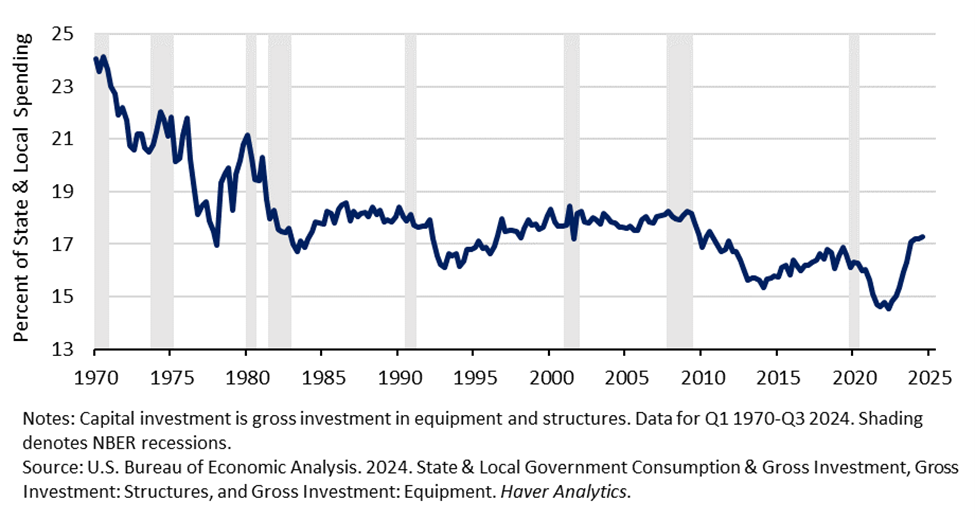
Public infrastructure—which includes highways and public transit—is essential to unleashing private sector productivity.[37] Renewed public investment in ailing infrastructure is an important post-pandemic development to achieve this end. State and local capital investment—a major component of U.S. infrastructure spending—has grown as a share of state and local spending over the past two and a half years by the largest amount since 1980. Even though infrastructure investment typically falls as a share of the economy at the beginning of an economic recovery, the post-pandemic U.S. economy has bucked this trend. As shown in Figure 21, the share of state and local government budgets devoted to capital investment fell sharply in the 1970s and early 1980s before stagnating, eventually drifting downwards following the 2008 financial crisis. During the COVID-19 pandemic, state and local capital investment fell in lockstep with broader economic output, and in the initial stages of the recovery, failed to keep pace with the sharp rebound in economic activity. However, since 2021—and the passage of the ARP and the BIL, both of which included substantial support for state and local governments—capital investment has rebounded to pre-pandemic levels.[38] The two-and-a-half-year increase in state and local capital investment as a share of state and local spending—2.7 percentage points—is the largest since 1980.
Figure 22: State & Local Capital Investment as Share of State & Local Spending
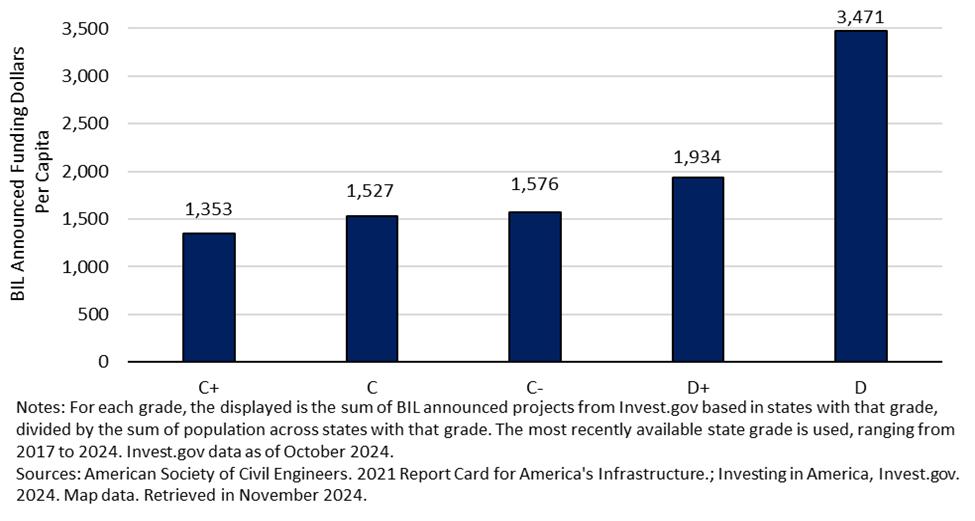
And importantly, the new funding from the BIL appears to be landing in the places that need it most. The American Society of Civil Engineers (ASCE) grades U.S. states on the quality of their infrastructure across several dimensions, including roads, bridges, water, and public transit. Overall infrastructure grades for states range from C+ to D—itself a recognition of the challenged state of our infrastructure overall that the BIL looks to address. Figure 23 shows the announced BIL funding per capita for states at each grade level, showing that states with lower overall grades are receiving more funding per capita. This finding increases confidence that the money is going to the places that need it most.
Figure 23: BIL Announced Funding per Capita vs. ASCE Infrastructure Grade
Ongoing Challenges
There are major ongoing structural challenges for middle-class households that have been building for decades, including a housing shortage of millions of units[39][40][41][42] Federal, state, and local governments have an essential role in addressing these longstanding challenges. Carefully constructed policies that tackle these issues—such as the incentives in the IRA that will bring high-paying manufacturing jobs to struggling geographies—will serve to grow the economy in the long term while they provide essential relief to middle-class families.
Conclusion
This report has focused on the context from which to judge the U.S. recovery from the pandemic recession. The pandemic was a tremendous shock to the economy and the policy response was key in driving a rapid recovery, leading to an economy that is now booming. Comparisons to other advanced countries, to past recessions, and to prior forecasts all suggest that the United States has done remarkably well in this recovery.
This finding does not mean that households and businesses are necessarily doing better than they would have had there never been a pandemic. The high levels of inflation in the recovery period have led to prices that are much higher than before the pandemic, straining the budgets of many Americans. However, our analysis suggests that tamping down on that inflation earlier could have risked higher unemployment, lower wages, and a less-vibrant economy, and, even in that case, peak inflation would have been only slightly lower. That inflation has come down so close to target already without triggering any of those outcomes is a policy success.
Now that the recovery is close to complete, it is time to look forward. Supply-side policies such as those embedded in the BIL, the CHIPS and Science Act, and the IRA are designed to boost future productivity and to grow our capital stock. Already, there are promising signs in new business formation, a high-tech manufacturing boom, and increased investment in public infrastructure. The administration’s novel economic policymaking toolkit will serve as guidance to future leaders who seek to expand the supply-side of the economy in an effective and equitable way.
There are, of course, important economic challenges that remain: a housing shortage, high childcare costs, and insufficient job training programs. More broadly, the outlook for productivity remains uncertain, with phenomena such as climate change and artificial intelligence rapidly changing the economic landscape. The strong recovery discussed in today’s report provides policymakers and business leaders a resilient economy with which to face these challenges.
[1] Aguinaldo, Joseph, Jules Valencia, and Wolters Kluwer. “Blue Chip Economic Indicators.” October 2020.
[2] Van Nostrand, Eric, and Laura Feiveson. “An Update to ‘The Purchasing Power of American Households.” U.S. Department of the Treasury, July 18, 2024; last modified December 19, 2024: A Third Quarter Update to “The Purchasing Power of American Households” | U.S. Department of the Treasury.
[3] Wheat, Chris, and George Eckerd. “The purchasing power of household incomes: Worker outcomes through July 2024 by income and race.” JPMorgan Chase, September 12, 2024.
[4] Board of Governors of the Federal Reserve Board. 2022 Survey of Consumer Finances. Table 4 – Family Net Worth, by Selected Characteristics of Families, 1989-2022 Surveys. 2023.
[5] Board of Governors of the Federal Reserve Board. 2022 Survey of Consumer Finances. Table 12 – Leverage Ratio of Group, by Selected Family Characteristics, 1989-2022 Surveys. 2023.
[6] Van Nostrand, Eric. “Small Business and Entrepreneurship in the Post-COVID Expansion.” U.S. Department of the Treasury, September 3, 2024.
[7] Dao et al. “Inflation’s Rise and Fall.” Journal of Monetary Economics. November 2024; Gazzani and Ferriani. “The impact of the war in Ukraine on energy prices: Consequences for firms’ financial performance.” Center for Economic and Policy Research. October 7, 2022.
[8] Pethokoukis, James. “America’s “Exceptional” Post-Pandemic Economy.” American Enterprise Institute. August 28, 2024; U.S. Treasury calculations.
[9] The International Monetary Fund tracked responses to the COVID-19 pandemic for countries worldwide.
[10] For the United States, refer to the Federal Response to COVID-19 report by the Government Accountability Office. The Canadian government provides an overview of their COVID-19 economic response plan here.
[11] For information on the Job Retention Scheme instituted by the United Kingdom, refer here to a report by His Majesty’s Treasury and His Majesty’s Revenue and Customs. More details on the pandemic response by the Japanese government can be found in Kotera and Schmittmann (International Monetary Fund).
[12] For every G7 country except Canada, our wage data are harmonized and seasonally adjusted for the total private sector from the Organization for Economic Co-operation and Development (OECD). For Canada, we used data from the Canadian government.
[13] The OECD provides harmonized, seasonally adjusted manufacturing wage data for every G7 country.
[14] The Fed’s target measure for inflation is the broader PCE price index, which has run between two to four tenths lower than CPI inflation.
[15] Japan’s inflation rate is historically high; the country has battled persistent deflation since the 1990s.
[16] Board of Governors of the Federal Reserve Board. 2022 Survey of Consumer Finances. Table 4 – Family Net Worth, by Selected Characteristics of Families, 1989-2022 Surveys. Survey of Consumer Finances. 2023.
[17] Board of Governors of the Federal Reserve Board. 2022 Survey of Consumer Finances. Table 4 – Family Net Worth, by Selected Characteristics of Families, 1989-2022 Surveys. 2023.
[18] Van Nostrand, Eric. “Remarks by Assistant Secretary for Economic Policy (P.D.O.) Van Nostrand on U.S. Business Investment in the Post-COVID Expansion.” U.S. Department of the Treasury, November 13, 2024.
[19] Board of Governors of the Federal Reserve Board. 2022 Survey of Consumer Finances. Table 9 – (%s & Medians) Family Holdings of Nonfinancial Assets and of Any Asset, by Selected Characteristics of Families and Type of Asset, 1989-2022 Surveys. 2023.
[20] Yellen, Janet L. “Remarks by Secretary of the Treasury Janet L. Yellen at Press Conference During the G20 Finance Ministers and Central Bank Governors Meetings.” U.S. Department of the Treasury. July 25, 2024.
[21] Aguinaldo, Joseph, Jules Valencia, and Wolters Kluwer. “Blue Chip Economic Indicators.” October 2022.
[22] Datta, Deepa D., Laura Feiveson, Ekaterina Peneva, and Gisela Rua. “Bottlenecks, Shortages, and Soaring Prices in the U.S. Economy.” Board of Governors of the Federal Reserve System, June 24, 2022.
[23] According to the December 2020 Employment Situation from U.S. Bureau of Labor Statistics, unemployment in December 2020 was 9.8 million less than in February 2020 .
[24] This inverse relationship between changes to inflation and unemployment holds after controlling for changes in aggregate supply, or supply shocks generally, and inflation expectations. Movements of aggregate supply can lead to the opposite result, with increases in inflation associated with increases in unemployment. Inflation expectations are strongly positively related to and help to determine the trend in inflation. The initial rise in inflation that arose because of the pandemic was driven by a large contraction of aggregate supply.
[25] To make these calculations, we assume a linear Phillips Curve. First, we calculate the extent to which monthly annualized core PCE inflation exceeded the target of 2 percent for every month in 2021 and 2022. We then divide those excess inflation estimates by estimates of the Phillips Curve slope (which is the percentage point change in the inflation rate per 1 percentage point change in the unemployment rate) to determine how much higher unemployment would have had to be in each month to bring inflation down to target. We use the following “reduced-form” estimates of the Phillips Curve slope: -0.57 from Ball & Mazumder (2015) and ‑0.34 in Hazell et al. (2022).
[26] A non-linear Phillips Curve that has a steeper slope when the labor market is tight would suggest that a smaller rise in unemployment is needed to bring down inflation. This is proposed in Benigno, Pierpaolo and Eggertsson (2024) “Revisiting the Phillips and Beveridge Curves: Insights from the 2020s Inflation Surge,” Jackson Hole Economic Policy Symposium, August 2024.
[27] Crump, Richard K., Stefano Eusepi, Marc Giannoni, and Ayşegül Şahin. 2024. “The Unemployment-Inflation Trade-off Revisited: The Phillips Curve in COVID Times.” Federal Reserve Bank of New York, March 2024.
[28] Backing out the implied estimate of the Phillips Curve relationship, we calculate that it would have taken an unemployment rate of 16 percent to have brought down inflation to 2 percent. To derive this, we take the implied reduced form Phillips curve slope from their estimates. They estimate that the unemployment gap peaked at -3.5 percent, which can account for about 1.5pp of the difference between realized median CPI at peak (about 7.5 percent) and the long run average (about 2.5 percent). This gives a slope of about .42 for median CPI. This implies that for median CPI to remain at 2.5 percent, the unemployment rate would need to have been 11.67 percentage points higher at peak. Unemployment averaged about 4.5 percent during 2021-2022.
[29] Barnichon, Regis. “What If? Monetary Policy in Hindsight.” Federal Reserve Bank of San Francisco Economic Letter, October 11, 2022.
[30] Aguinaldo, Joseph, Jules Valencia, and Wolters Kluwer. “Blue Chip Economic Indicators.” September 2024.
[31] Council of Economic Advisors. FACT SHEET: President Biden Announces New Actions to Strengthen America’s Supply Chains, Lower Costs for Families, and Secure Key Sectors. November 27, 2023.
[32] Van Nostrand, Eric. 2024. “Small Business and Entrepreneurship in the Post-COVID Expansion.” U.S. Department of the Treasury, September 3, 2024.
[33] While business formation data for the pandemic period are not fully available, application rates have historically been predictive of actual business formations. Based on pre-Covid data, actual business formations from the subsequent eight quarters have a correlation coefficient of +0.9 with applications from likely employers.
[34] Haltiwanger, John C. "Entrepreneurship during the COVID-19 Pandemic: Evidence from the Business Formation Statistics," Entrepreneurship and Innovation Policy and the Economy, University of Chicago Press, vol. 1(1), pages 9-42. 2022.
[35] Decker, Ryan A., and John Haltiwanger. Surging Business Formation in the Pandemic: Causes and Consequences? Brookings Papers on Economic Activity. 2023.
[36] Council of Economic Advisors. FACT SHEET: A Record 20 Million New Business Applications | The White House. November 14, 2024.
[37] Aschauer, D. “Is Public Expenditure Productive?” Journal of Monetary Economics 23: 177-200. 1989. Successfully replicated by Clarke, Christopher, and Raymond G. Batina. 2019. “A Replication of ‘Is Public Expenditure Productive?’ (Journal of Monetary Economics, 1989).” Public Finance Review 47 (3): 623-629.
[38] Within the ARP, the State and Local Fiscal Recovery Fund and the Capital Projects Fund included substantial support that could have been used for state and local infrastructure.
[39] Feiveson, Laura, Arik Levinson, and Sydney Schreiner Wertz. “Rent, House Prices, and Demographics.” U.S. Department of the Treasury. June 24, 2024.
[40] U.S. Department of the Treasury. “The Economics of Childcare.” September 2021.
[41] Himes, Douglas. “Men’s declining labor force participation.” U.S. Bureau of Labor Statistics. May 2018
[42] Feiveson, Laura. “How does the Well-Being of Young Adults Compare to Their Parents’?” U.S. Department of the Treasury. December 18, 2024.
